A Choropleth Map Example with vanilla JS
Gourmet Data is a blog where a data journalist breaks down questions. Subscribe either here or on Substack.
So much of information design relates to context. Data presented on a place like the United States is often complicated enough that information needs to be divided into contexts, namely state by state or county by county.
Thus, comes one of my favorite data viz formats: the choropleth map. Today, I will teach you how to code a super simple online choropleth map example, and go over the basics. The checklist:
- Encode information into an SVG
- Import the SVG into some HTML code
- Apply basic CSS styling to the SVG
- Use Javascript to sort the SVG Elements Into Classes
- Add interactivity with buttons
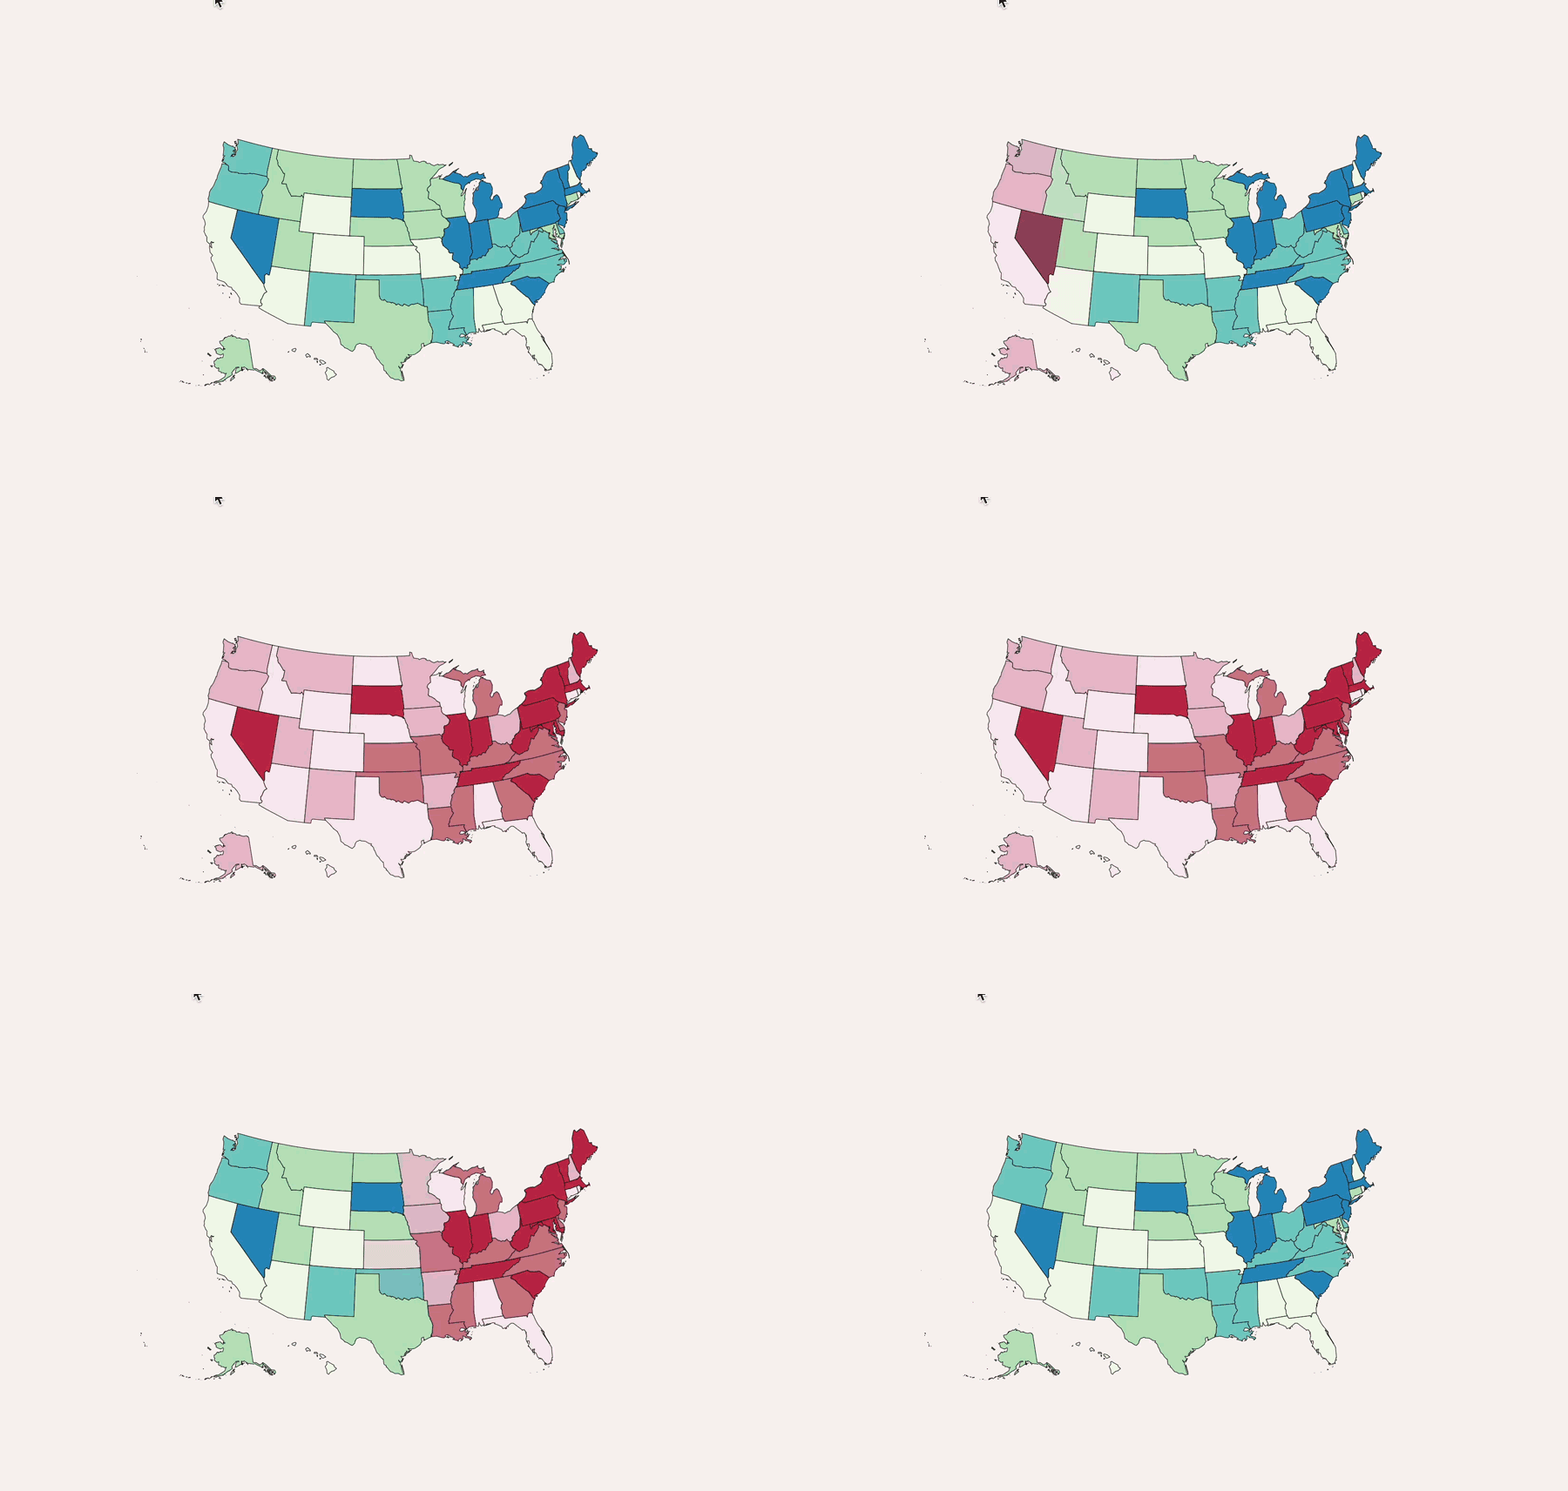
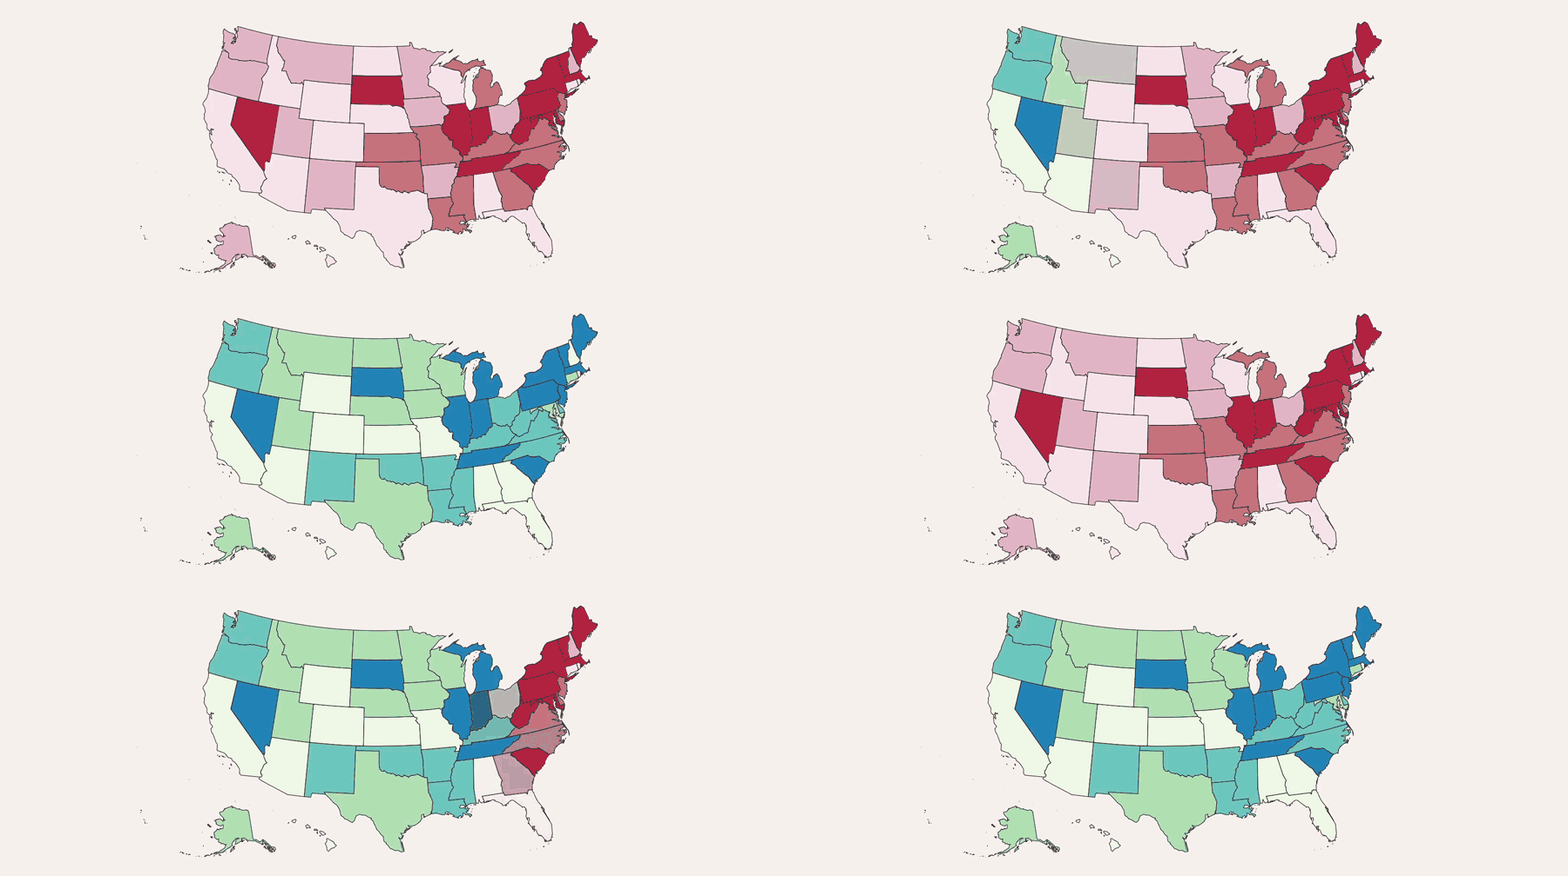
Here's an example of a map with two arbitrary metrics; when you click on the button, you can see each state change color. I forgot to add a key, but hopefully this shows the point.
Lorem ipsum dolor sit amet, consectetur adipiscing elit
Lorem ipsum per month
Source: Our World in Data
Why Choropleth Maps?
There's much debate on how useful choropleth maps truly are, especially the interactive ones, and I get it. If you really wanted to compare two metrics state by state, something like a dot chart might be more functional.
Still. My whole thing is 'information is beauty' and, I really like the way these charts look. So fuck it.
There are probably a few different ways to accomplish a simple choropleth map like this, but this solution takes about 100 lines of HTML, CSS, and JS code, so I figured I'd walk through the process quickly here.
For the skimmers, here's the full Codepen for the code.
Encoding Information into an SVG
The logic of this code is based on a few things, starting with an svg. As SVGs are lines of code; similar to HTML, it can be broken down to different sub-elements (HTML has <div> and <h2>, SVG has <circle> and <path>). Some developers (me) love playing around with them, as they are relatively easy to alter via CSS and JS.
To start with the example from above, we'll have to get an SVG of the US. There are many ways to get an SVG; wikipedia has a few, as do some of these other sites, including mine. I'll grab a simple one and we'll work with that.
Now, an important aspect of this tutorial is that the SVG has the information encoded into it. In my examples, my data is usually something simple, with a simple 'key-value' pair for every state.
There are many ways to ensure that the state SVGs have the appropriate data; I'll eventually write a guide, but there are ways to do this in both Javascript and Python. Frankly, in this world of AI, we can run a query in chatGPT, where we encode an SVG, like this one here, with a 50-state dataset.
//Example lines of the svg
<path data-name="Nevada" data-id="NV" data-metric1="5" data-metric2="10"
        d="m 294.82662,295.8307 10.09457,-62.79983 5.14434,-31.44846 0.58238,-3.10601 -2.81483,-0.48532 -10.96813,-2.03833 -27.46887,-5.43553 -2.71776,-0.58238 -2.71777,-0.58238 -13.6859,-3.00895 -24.55697,-5.82379 -2.71777,-0.67944 -0.87357,3.68839 -13.20058,56.00542 11.45345,16.50074 11.8417,16.40366 20.96563,30.08957 15.04479,21.15976 7.76505,10.38575 2.52364,3.39721 0,-0.29119 1.55301,-3.30014 0.0971,-15.43304 4.27078,-3.59133 3.39721,3.00895 2.23245,0.0971 4.27078,-18.83025 0,-0.19413 0.48531,-3.10602 z"
style="stroke-width:0.97063118000000004;" />

 //Each state is reprented by a path in the SVG
<path data-name="New Mexico" data-id="NM" data-metric1="3" data-metric2="11"
        d="m 472.45213,324.75551 0.0971,-2.52364 0.0971,-2.52364 0.0971,-2.52364 -3.10602,-0.0971 -21.45095,-0.97063 -21.54801,-1.35889 -48.91981,-4.27077 -3.00896,-0.29119 -0.38825,3.49427 -7.27974,75.12685 -0.67944,7.08561 -2.71777,28.63362 0.38826,0.0971 13.39471,1.26183 1.26182,-6.79442 2.42658,-1.94127 27.17767,2.42658 0.19413,0 -2.42658,-4.75609 12.32701,0.87357 30.76901,1.74713 19.2185,0.87357 3.30015,-91.0452 0.67944,0.0971 0.0971,-2.62071 z"
        style="stroke-width:0.97063118000000004;" />

//In both HTML and XML, you can encode data properties into elements (eg data-name, data-id)
      <path data-name="Utah" data-id="UT" data-metric1="7" data-metric2="12"
        d="m 352.38505,204.97962 -25.04228,-3.78546 -13.97709,-2.23245 -2.71777,-0.48531 -0.58238,3.10601 -5.14434,31.44846 -10.09457,62.79983 -0.48531,3.10602 2.52364,0.38826 25.04228,3.97958 17.56843,2.52365 32.71027,4.07665 2.52364,0.29119 0.19413,-2.52364 0.7765,-7.66799 1.8442,-17.66549 5.24141,-50.56988 0.29119,-2.52365 -1.94126,-0.19412 -24.7511,-3.00896 -3.78546,-0.48531 2.42658,-18.92731 0.19412,-1.26182 -2.81483,-0.38826 z"
        style="stroke-width:0.97063118000000004;" />
In order for this to work, each of the states should be represented by one of the SVG sub-elements, and those subelements should have certain properties, such as:
- data-name: name of the state
- data-id: initials of the state, so we can identify it
- d: the path that draws the SVG....it's long
- data-metric: some metric, as we will use this to determine the color of the state during a certain filter
To keep this in simple terms, to prepare our SVG, we will want an SVG of the 50 states in the US, with each state stored as a sub element (most likely <path> or <g>), and each sub-element should have a few identifiable data attributes, namely the state name and/or abbreviation (for reference), and the metric with which you want to compare the states.
Importing the SVG into the HTML code
From an code standpoint, SVGs are just as readable as HTML, and CSS properties apply to them just as they do to regular HTML elements. So, our goal should be to import our prepared SVG into our HTML code and write our CSS rules to target those SVG elements.
The load in an SVG into an HTML file, there are a few options. Today, most frameworks have some sort of import mechanism. If you're using a framework like React, we would load in the SVG from a local file and bundle everything at the end of our process so our files stay clean.
    import { ReactComponent as MyIcon } from './my-icon.svg';

    const App = () => (
      <div>
        <MyIcon />
      </div>
    );
Personally, I don't need to go so complicated, as I tend to stick with regular HTML, CSS, and JS.
If using plain CSS and JS, technically we can import the SVG using the <img> element or load the SVG via the <object> tag, but that would make it impossible for the CSS rules to target the elements. So instead, I just copy and paste the SVG into whatever environment I'm working from.
<!--  where the CSS code will eventually go -->
<style>
</style>

<!-- paste the SVG here, inside an HTML container -->
<div class="svg-container category1">
    <svg xmlns:svg="http://www.w3.org/2000/svg" xmlns="http://www.w3.org/2000/svg" enable_background="new 0 0 1000 589" height="589px" style="stroke-linejoin: round; stroke:#000; fill: none;"
      width="1000px" id="svg">

       //List of all 50 states and their attributes
    <path data-name="Nevada" data-id="NV" data-metric1="5" data-metric2="10"
        d="m 294.82662,295.8307 10.09457,-62.79983 5.14434,-31.44846 0.58238,-3.10601 -2.81483,-0.48532 -10.96813,-2.03833 -27.46887,-5.43553 -2.71776,-0.58238 -2.71777,-0.58238 -13.6859,-3.00895 -24.55697,-5.82379 -2.71777,-0.67944 -0.87357,3.68839 -13.20058,56.00542 11.45345,16.50074 11.8417,16.40366 20.96563,30.08957 15.04479,21.15976 7.76505,10.38575 2.52364,3.39721 0,-0.29119 1.55301,-3.30014 0.0971,-15.43304 4.27078,-3.59133 3.39721,3.00895 2.23245,0.0971 4.27078,-18.83025 0,-0.19413 0.48531,-3.10602 z"
style="stroke-width:0.97063118000000004;" />
      <path data-name="Nebraska" data-id="NE" data-metric1="5" data-metric2="12"></path>
      <path data-name="New Mexico" data-id="NM" data-metric1="8" data-metric2="10"></path>
      <path data-name="New York" data-id="NY" data-metric1="2" data-metric2="16"></path>
      //rest of the 50 states...
    </svg>
</div>

<!--  where the JS code will eventually go -->
<script>
</script>
I'm a bit of a brute, so this works for me; since most of my projects are hosted on a variety of CMSs, the flexibility abd transportability of plain HTML, CSS, and JS is hard to beat. Just be mindful of CORS policy, as that is usually an issue when dealing with elementary HTML, CSS, and JS files.
Applying the CSS colors to the SVG
This is a choropleth map, so the focus is on categorizing states into X amounts of buckets. There are no right answers to the question on how many buckets of categories you should have; I chose 4 groups of quantiles, but technically you can divide the data into however many categories, within reason.
There are many ways to do this, but the simplest for me is this: we have the buttons trigger a change in class on the container div that holds the SVG. We will then write CSS rules that change the color of an SVG path element depending on the its class. Lucky for us, because SVG is made up of the sub elements (<path>, <g>, etc), CSS rules still applies to them.
Because of that, when looking at the SVG, we'll have to assign each path a class that represents one of the four groupings (group1, group2, etc). We'll assign these based off their data-metric properties. Then, using CSS inheritance, we'll set different conditions using the data-attributes set in the SVG.
Later on, we'll create buttons that'll switch the class of the container div (between category1 and category2) so we can alternate between the two colors.
.category1 path[data-metric1="group1"] {
  fill: #f0f9e8;
}

.category1 path[data-metric1="group2"] {
  fill: #bae4bc;
}

.category2 path[data-metric2="group1"] {
  fill: #bf2b49;
}

.category2 path[data-metric2="group2"] {
  fill: #cc7b8b;
}
In order to do all of this, we need to iterate over every path in the SVG and give it a class that represents one of the four groupings (group1, group2, etc).
Use Javascript to sort the SVG Elements Into Classes
So, the following function sorts all the values, and determines the number of total items in the dataset, as well as the different categories we decided in the CSS. By dividing the two numbers, we can get an upper bound index for each of the four quantiles. We'll use those bounds to create ranges, allowing us to then get a state's intended category by getting their name and their value for the specific metric.
// Define categories for data-metric1 and data-metric2
const categoriesBank = ['group1', 'group2', 'group3', 'group4'];

// Function to fetch the quantiles using a set of values
function getQuantileCategory(value, values, categories) {
  const sortedValues = [...values].sort((a, b) => a - b);
  const quantileSize = Math.floor(values.length / categories.length);

  for (let i = 0; i < categories.length; i++) {
    const upperBoundIndex = (i + 1) * quantileSize - 1;
    const upperBound = sortedValues[Math.min(upperBoundIndex, sortedValues.length - 1)];

    if (value <= upperBound) {
      return categories[i];
    }
  }
  return categories[categories.length - 1]; // For values greater than the last quantile
}
From there, we choose the metrics we want to filter by, and create a function that ties everything together. We iterate over every path in the US svg map; in this particular instance, the paths correlate to the states. From there, we read in the path's data-id property to identify them, and their data-metric1 and data-metric2 properties to use for calculating their quantile category.
Once we know their data metric properties, we call the getQuantileCategory() function from above, and receive that state's quantile category, eg 'group1', 'group2', 'group3', or 'group4'. The CSS should do the rest of the work from there.
// Create or fetch the dataset
data = [
  { "state": "AL", "metric1 ": 4, "metric2 ": 7 },
  { "state": "AK", "metric1 ": 8, "metric2": 15 }
  .
  .
  .
]

// Extract data-metric1  and value2 from data
const metrics1 = data.map(item => item.metric1);
const metrics2 = data.map(item => item.metric2);

// Function to categorize and update SVG
function categorizeAndUpdateSVG(data) {
  data.forEach(item => {
    const path = document.querySelector(`path[data-id="${item.state}"]`);
    if (path) {
      const category1 = getQuantileCategory(item.metric1, metrics1, categoriesBank);
      const category2 = getQuantileCategory(item.metric2, metrics2, categoriesBank);
      path.setAttribute('data-metric1', category1);
      path.setAttribute('data-metric1-num', item.metric1);
      path.setAttribute('data-metric2', category2);
      path.setAttribute('data-metric2-num', item.metric2);
    }
  });
}
Adding Interactivity with Buttons
We'll create some buttons that'll switch between metric1 and metric2. Creating the event handler for these buttons is pretty trivial; we fetch the container div using good old vanilla JS, and change its classList. The wonders of vanilla JS, I tell you what.
We'll create a function that does all of this, and attach this function to trigger whenever the either buttons are pressed. We'll set the class name of the container div depending on the data-attribute of the button.
<!--  where the CSS code will eventually go -->
<style>
</style>

<!--  where the JS code will eventually go -->
<script>
document.addEventListener('DOMContentLoaded', (event) => {
  const buttons = document.querySelectorAll('.state_map_button');
  const svgContainer = document.querySelector('.svg-container');

  buttons.forEach(button => {
    button.addEventListener('click', function() {
      // Remove 'active' class from all buttons
      buttons.forEach(btn => btn.classList.remove('active'));

      // Add 'active' class to the clicked button
      this.classList.add('active');

      // Clear all category classes from svg-container
      for (let i = 1; i <= buttons.length; i++) {
        svgContainer.classList.remove(`category${i}`);
      }

      // Get text of the button just clicked
      const option = this.textContent.trim();

      // Add the appropriate category class based on the button text (option)
      switch (option) {
        case 'Option 1':
          svgContainer.classList.add('category1');
          break;
        case 'Option 2':
          svgContainer.classList.add('category2');
          break;
      }
    });
  });
});
</script>
This way, we only need to apply a change to one DOM element to trigger the change in view. So the HTML will be quite simple actually. Just add the buttons and give them the appropriate default classes and onclick event handlers.
Conclusion
Hopefully this choropleth map example was a helpful tutorial. In this age of frameworks and web packages, there's something uncomplicated about vanilla JS that's refreshing.
Going forward, I'm not sure how useful bite-sized interactivity will be, but I'm betting my future career that it still has years to go lol.
