How To Analyze Text Data (Python Tutorial)

1. Why analyze text data?
There are a few reasons why one would need to analyze text data. But, the gist is that humans communicate through text, so text analysis is very informative.
Perhaps you want to be able to detect spam, and you’d run training sets on a classifier. Or maybe you want to get an interpretation of what the text says through numbers, such as how positive something was, how strongly said or something else.
The latter is the exact reason for my writing today. I happened upon the Miller Center’s database of Presidential speeches and figured I would peruse the dataset to see what I could find.
Thanks for reading Gourmet Graphs! Subscribe for free to receive new posts and support my work.
As an American, I should have somewhat of a feeling of reverence for the words of my nation’s leaders. Instead, I think it’s more meh. I’ve read some of them, and don’t get me wrong, there is some heat. But not enough for me to brown-nose.

Before diving into analysis, I took some time to understand the structure and content of our dataset. Below is a screenshot of how it looks, both in tabular form and in JSON format. This dataset was a treasure trove of information, containing details about each speech, including the title, the president, the date, and body of text. his initial exploration gave me a sense of the data I was working with and helped me plan my next steps.

2. Data Preprocessing
Data preprocessing is a crucial step in any data analysis project. It involves cleaning the data and preparing it for analysis, especially when it comes to text data. After all, it’s just a bunch of letters. How can we do any type of math-centric analysis on a bunch of letters?
First step is usually to check for missing values, but this dataset is pretty complete.
Next, I usually would streamline my process by dropping columns that were not relevant to whatever analysis I had planned. But, this dataset is small, so everything is pretty useful.
Below is a python command for giving a few basic stats about the transcript column aka the speeches.

Here’s the summary:
Shortest Speech: 481 letters
Longest speech: 188,344 letters
Average speech: 23,380 letters (~3 - 5k words)
70 state of the union speeches,
60 inaugural speeches
12 farewell speeches.
3. Text Tokenization
With our data cleaned, we moved on to the next step: tokenization.
Tokenization is a fundamental step in natural language processing. It helps convert our text data, which is unstructured, into a structured format that can be understood by machine learning models.
This process involves breaking down the text into individual words or ‘tokens’. We used the Natural Language Toolkit's (NLTK) Punkt tokenizer for this task, but there are others that differ by their method of tokenization, the languages they support, their handling of special characters and punctuation, and their approach to contractions and compound words. The Punkt tokenizer is a machine learning-based algorithm that's pre-trained to recognize sentences and words in several languages, so it seemed like a good first step.

By breaking down the text into tokens, we’re able to analyze each word individually.
4. Lemmatization and Stemming
After tokenization, we can undergo the optional process of lemmatization and stemming. These techniques reduce words to their root form, helping to combine different forms of the same word into one. For example, "cooking", "cooked", and "cook" all get reduced to "cook".
We used NLTK's WordNetLemmatizer for lemmatization and PorterStemmer for stemming. While both techniques aim to reduce words to their root form, they do so in slightly different ways. Lemmatization uses a vocabulary and morphological analysis to reduce words, resulting in real words. Stemming, on the other hand, simply removes the end of the word, which can sometimes result in non-real words.

Now, when researching, I’m told this makes it easier to analyze the text as we can treat all forms of a word as the same word. But, as I mentioned before, our dataset is relatively small. I did the process just to demonstrate what it is, but we can pretty much ignore this.
We also employ the TF-IDF (Term Frequency-Inverse Document Frequency) algorithm because it helps quantify the importance of each word in a document within a large collection of documents. That spit out a matrix (so, numbers) which we can then use for some of our models later on.
5. Breaking down a few ways to analyze text
Now, we have our text data in a tokenized format, so the data exploration can become really fun at this point.
How should we proceed?
Topic modeling and clustering
If you have no clue what a set of documents might be about, both topic modeling and clustering are approaches to getting a glance at what's inside. Topic modeling tries to find a set of topics that show up in the documents, while clustering organizes the documents into separate, discrete categories. So, with this option, I don’t really need to do much; I can let math do its thing.

We ran the TF-IDF (Term Frequency-Inverse Document Frequency) earlier, so we have a matrix to work with. Once we had this matrix, we could then apply the Latent Dirichlet Allocation (LDA) model to it. LDA is a generative probabilistic model used to extract hidden thematic structure in collections of documents. Essentially, it identifies potential topics based on word frequency from our TF-IDF results; here’s what it found.

In the above collection of words, you can see some trends in the topics…[america, work, people, one, etc] is a probable one that makes sense. However, not all of them did, and that just goes to show the limitations of working with data this small.
Sentiment analysis
Sentiment analysis is the idea that you can extract emotional meaning based on what people have written. This, along with the topic modeling, seemed to have the most legs, so I wanted to run some code here.
Our text data is already cleaned and preprocessed, so we’re able to perform sentiment analysis pretty easily.
I used the TextBlob library, which provides a simple API for diving into common natural language processing tasks. TextBlob allowed me to assign a sentiment score to each post, a number ranging from -1 (extremely negative) to 1 (extremely positive). This score represents the overall sentiment of the text. There was also a field for polarity, so I jotted down that information too, and added the results to a new column for each speech.

6. Insights and Findings
There are clearly different ways we could have taken our text analysis, but I figured I would move on to the visualization phase, mainly because that’s my favorite point.
At the end of the day, the point of text analysis is to learn something. What could I learn about the presidential speeches?
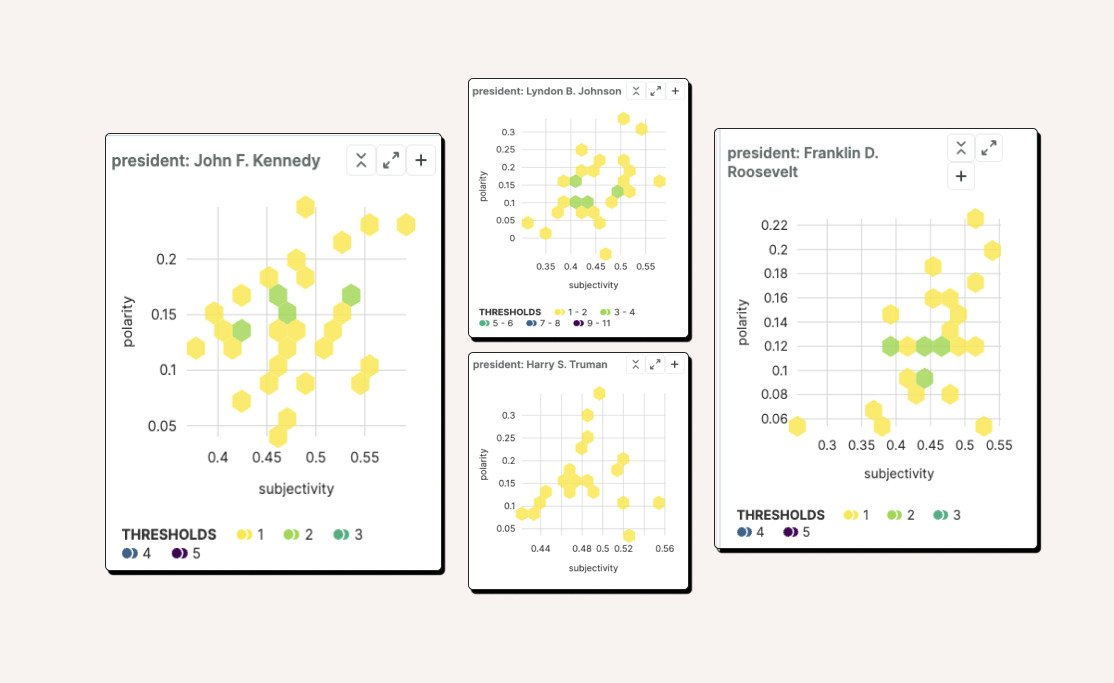
Well, I analyzed the sentiment and polarity scores of each speeches, so a hexagonal hex bin seemed fun. It would be a way to me to get a glimpse at where a president’s speeches graphed on a 2D chart, and it highlighted in green the most likely intersections. In the below instance, you can see that JFK might have been a little more positive than FDR.

The analysis also gave us an idea of what specific words were mentioned often together, and our list of topics in our topic modeling had some legs for a deeper analysis if we were truly motivated.
I hope this guide sparks your curiosity, as it's getting easier every day for anyone to dive into data analysis. The dream is to see small data enthusiasts popping up worldwide, each of us sharing our findings and learning more about the world together.
Thanks for reading Gourmet Graphs! Subscribe for free to receive new posts and support my work.