Who’s Making the Money in the Food Business?
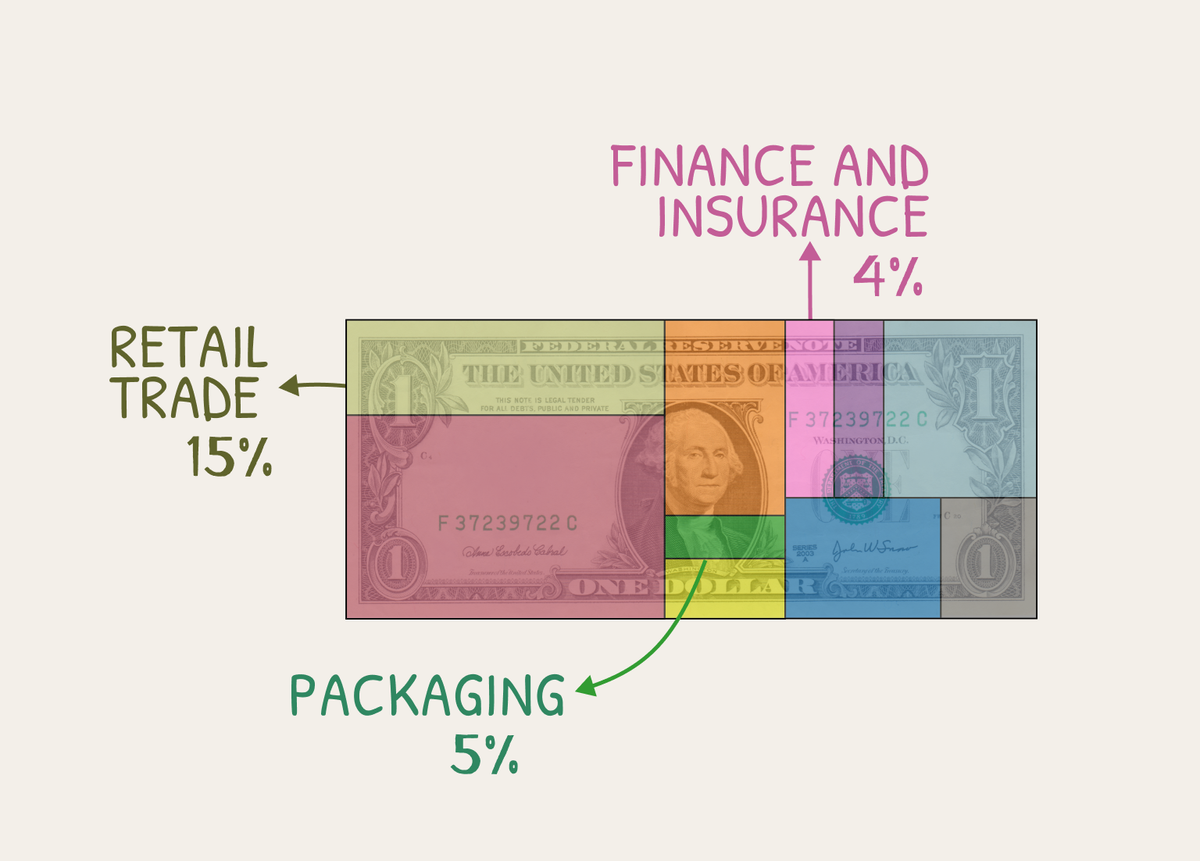
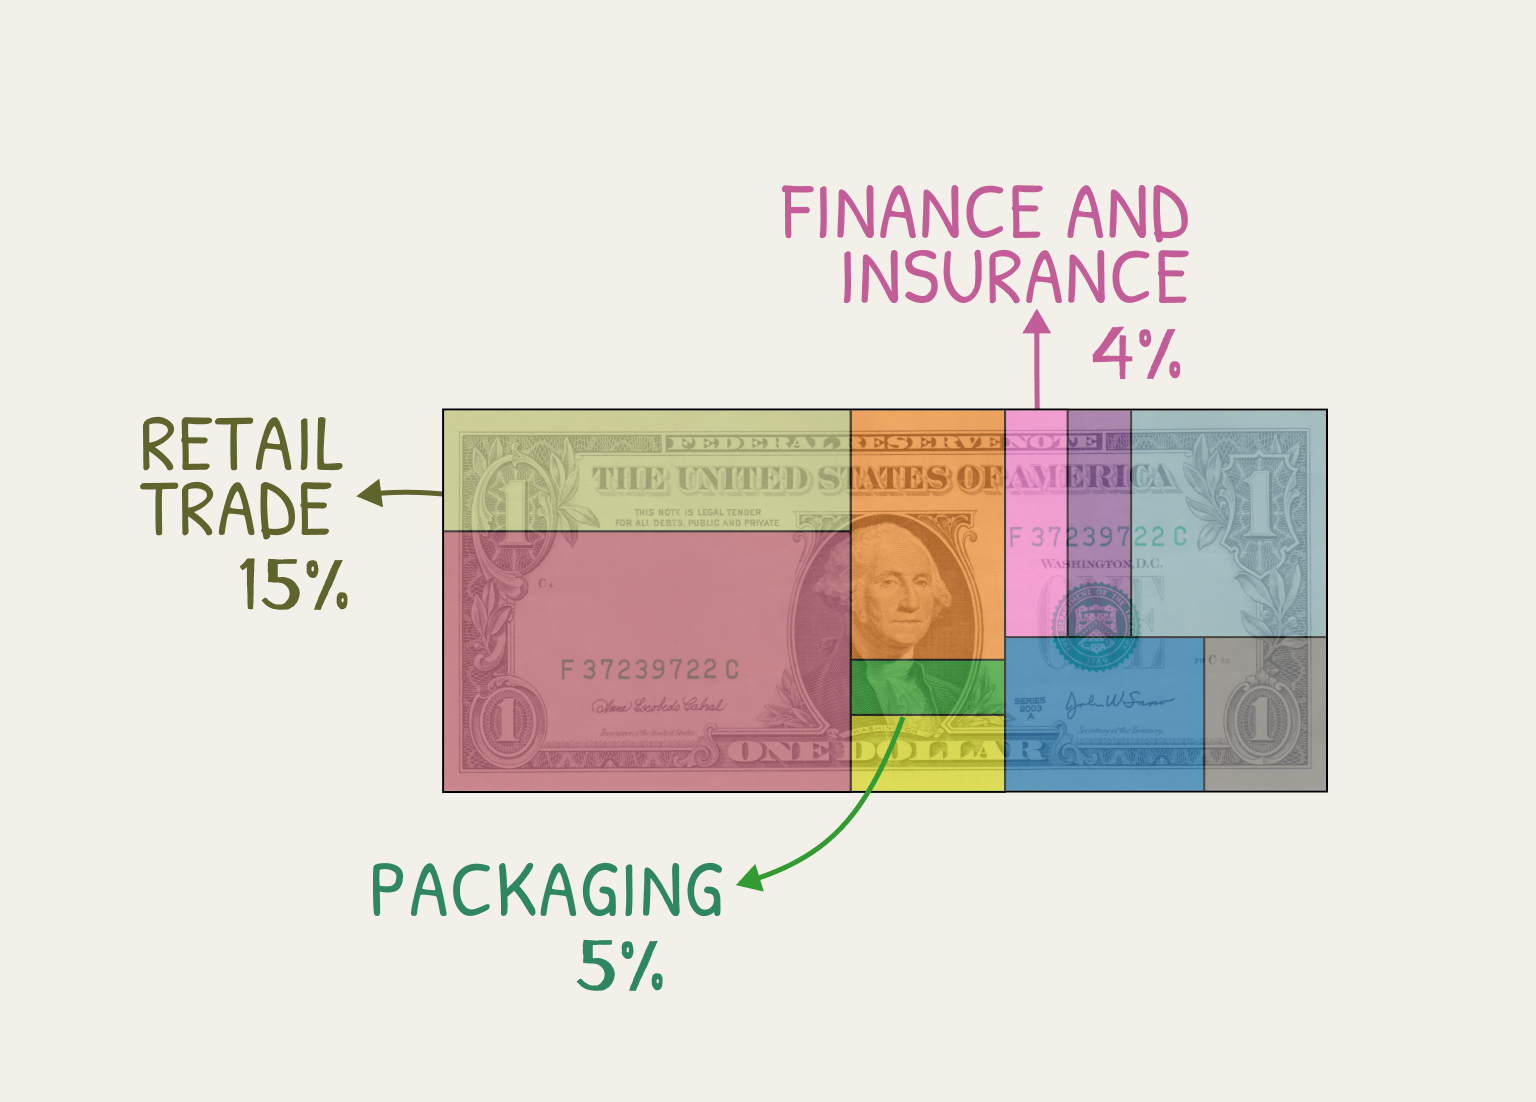
The U.S. Food Dollar is a metric developed by the USDA to better understand the costs of food spending. Essentially, it takes the total amount Americans spend on food, and segments how each dollar is distributed among the various industries along the supply chain. For instance, food service establishments received a share of about 31.5 cents for every 'food dollar' spent in 2023.
Here's a full screenshot of the USDA's version. I color-coded it to make it more clear, but then I got carried away and decided to make a new design, one that's a little more interesting to look at. Pick your fav.
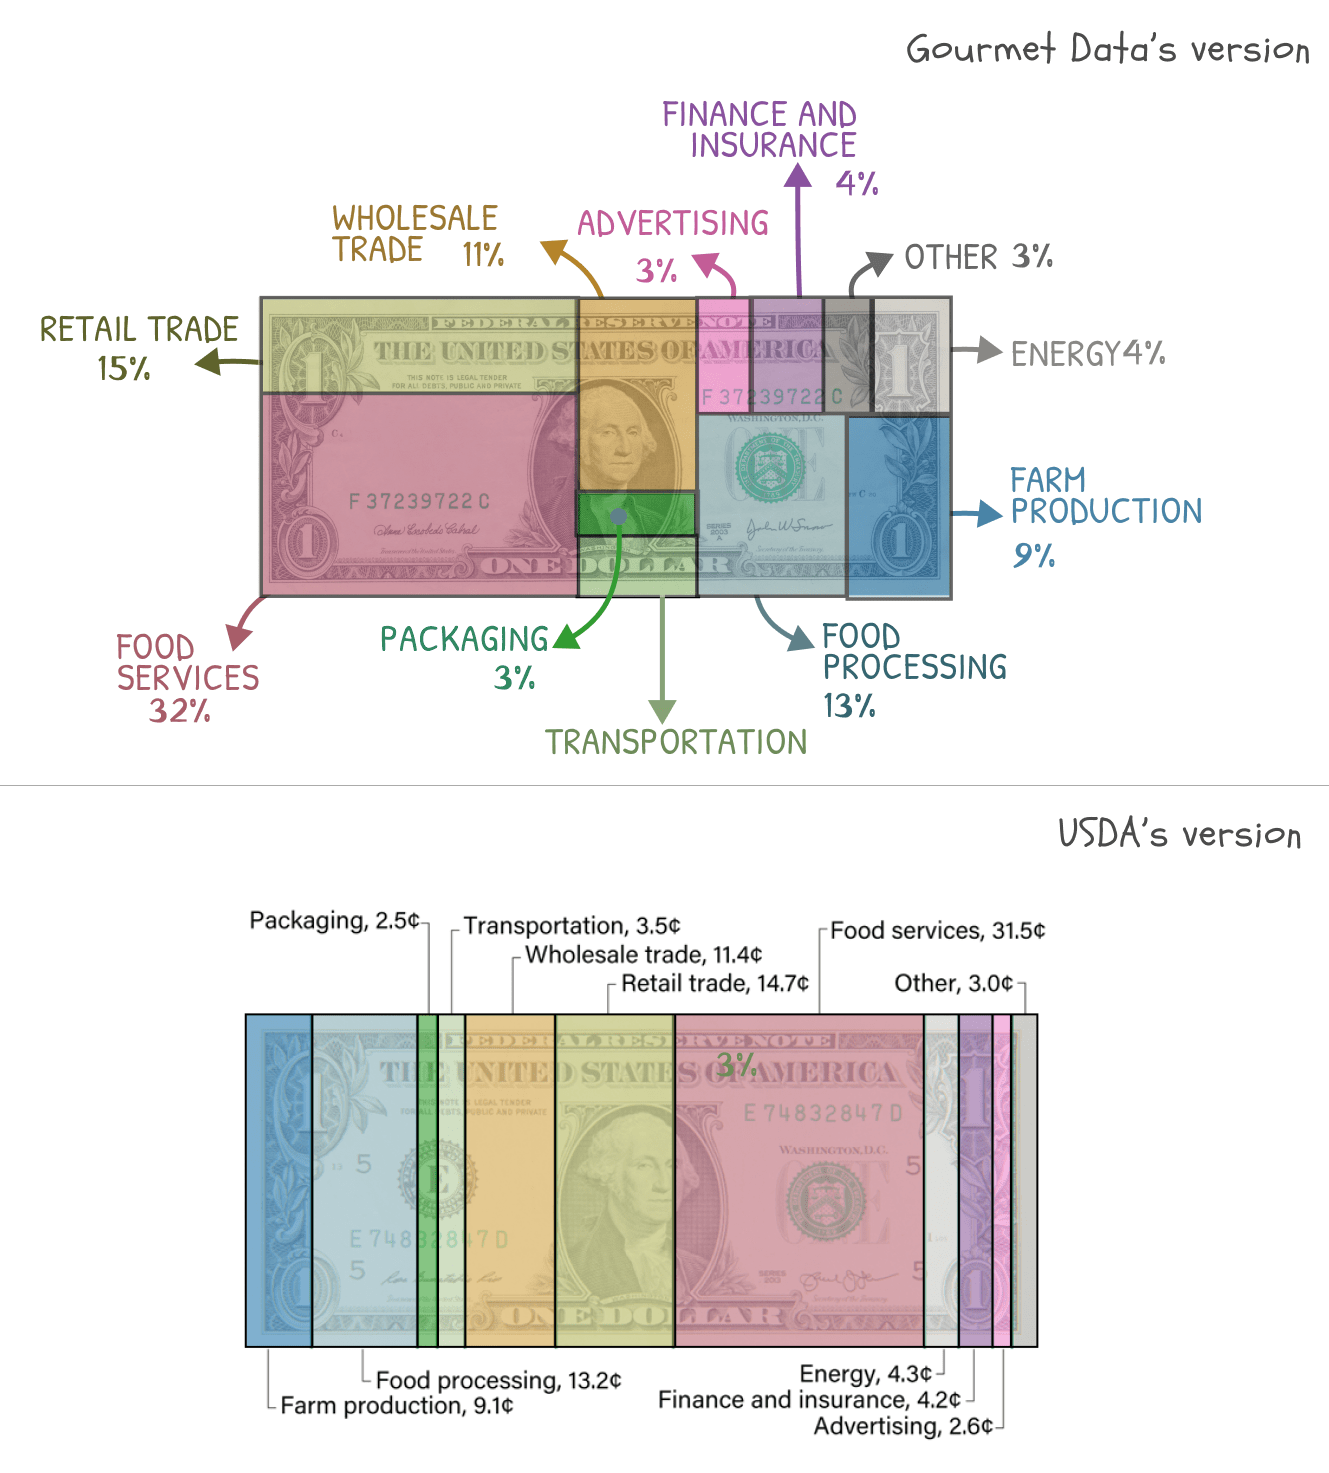
The food dollar is exactly the type of mnemonic device I love, so it kept my attention these last few weeks as the Thanksgiving holidays came around and gaslit Americans (me included) to spend even more money on food. Looking at the 12 or so subcategories of the 'food industry', I could see how they could be re-arranged into specific contexts, and there were three subcategories that came to mind in particular as being the most interesting:
- the people associated with the actual production and processing of the food (farmers, processors, etc)
- the intermediaries who essentially connect producers to consumers (wholesale distributors, supermarkets, etc)
- the food service industry; basically the people that serve food directly to the consumers
How much do the Food Producers get?
Arguably, the most important part of the food supply chain starts at the beginning, at the farm and processing levels.
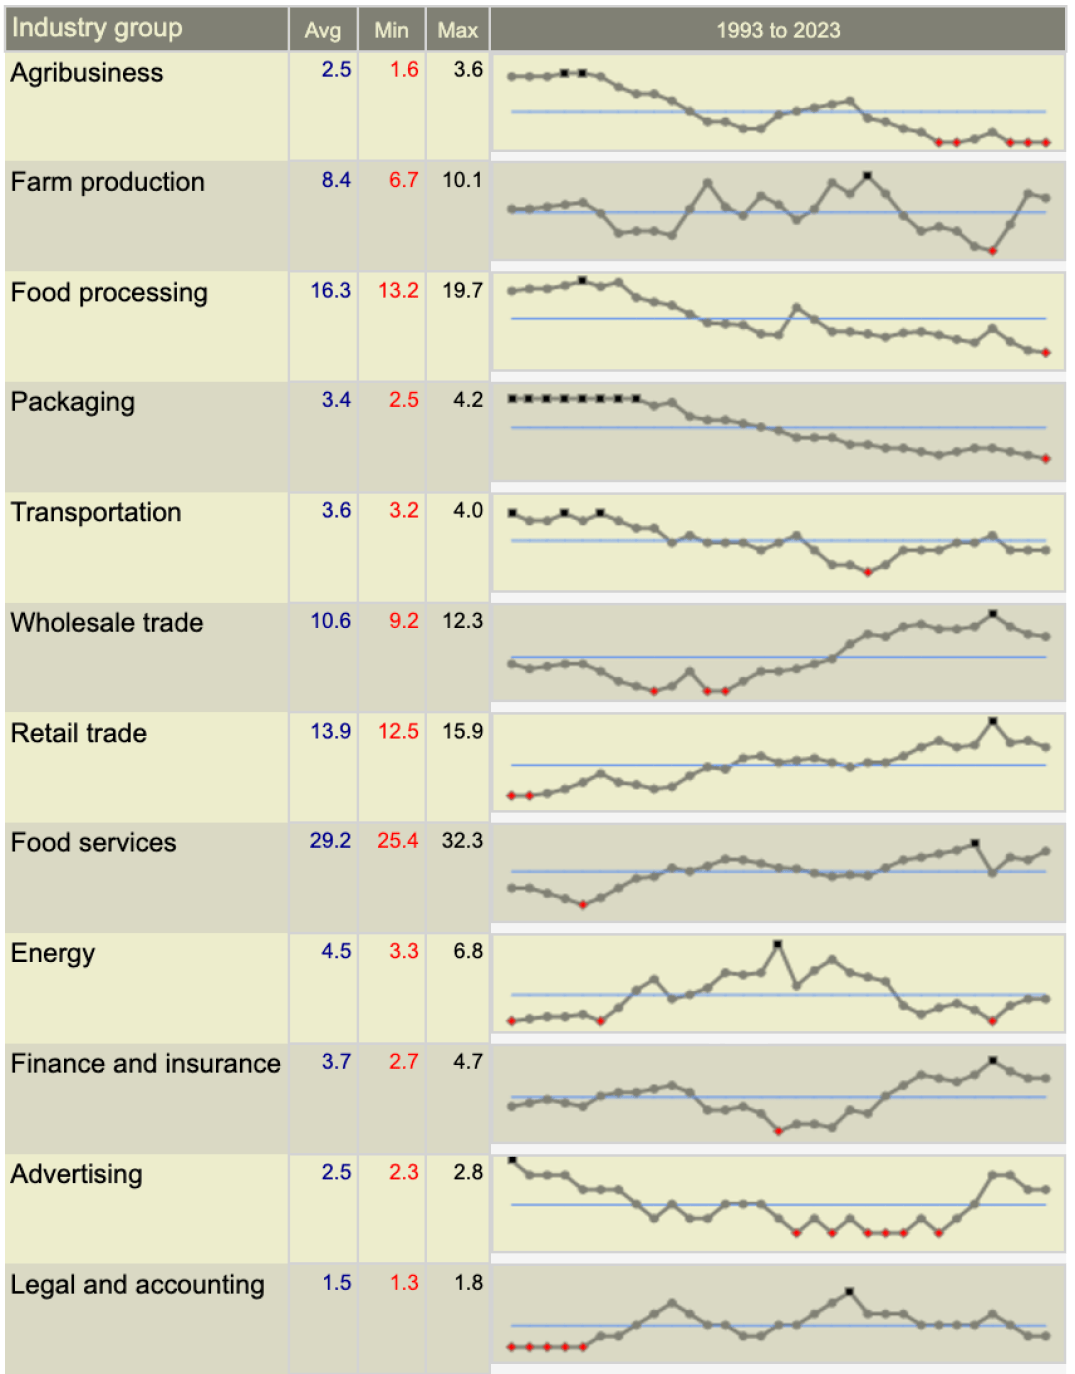
From the start, we can consider the farmers. In the Food Dollar series, farm production is defined as the cost of the raw materials used for all types of food production. The cost includes seeds, fertilizers, pesticides, animal feed, labor, and farm equipment, and most of it goes directly to the farmers. Its important to distinguish it from food processing, the part of the supply chain where we convert these raw materials into consumable items eg, turning raw milk into cheese.
I'm also adding in transportation and packaging into this section of food production because they make up the ability for food to move throughout the supply chain. This felt better than grouping them with the people businesses managing the distribution, and better than grouping them with the people serving the food. Technically, though, they are present in all parts of the supply chain. The same can be said about Energy.
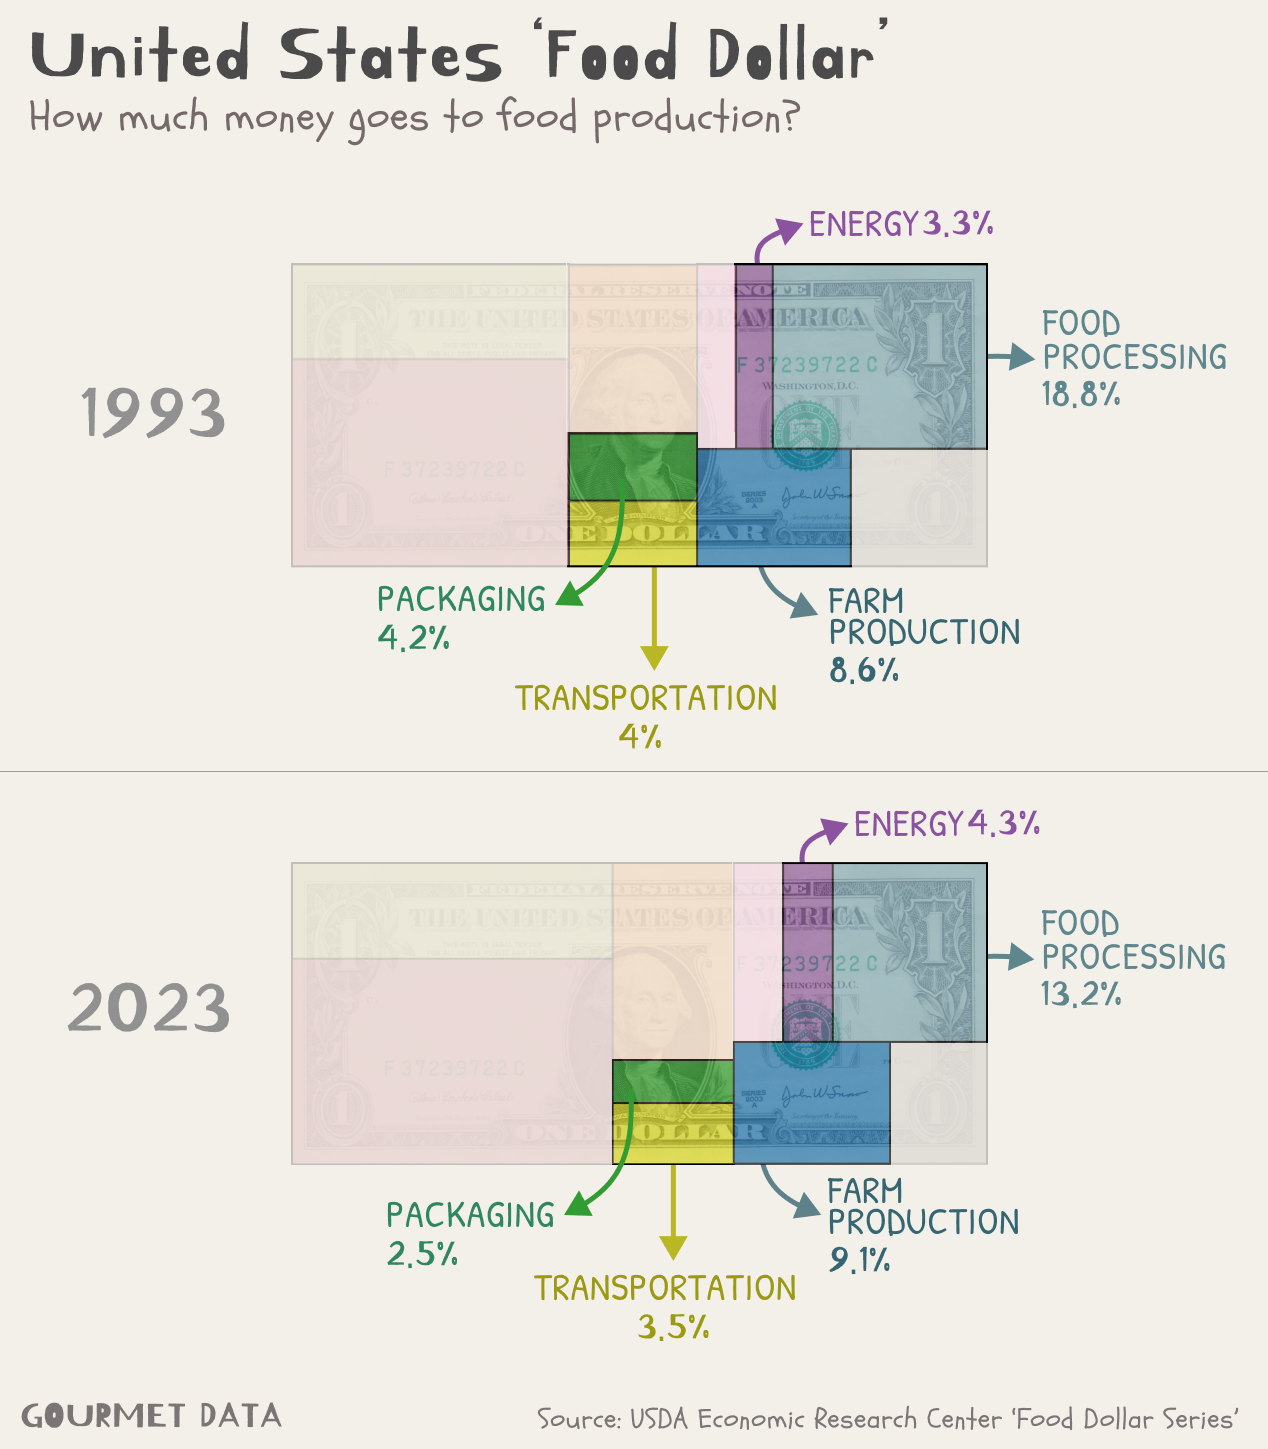
According to my grouping, the actual production part of food takes about a third of the total expenditure, and has become slightly cheaper since 1993.
The most noticeable insight is the decrease in cost of food processing; technological advancements probably account for most of it, though I wouldn't be surprised if the changes in consumer preferences and the stink of processed foods had a noticeable effect. That's a story for another blog, though.
The total allocated to the farmers has increased slightly, though much of that increase has happened in recent years, no doubt due to COVID. There has been substantial federal financial assistance to help boost the agriculture sector, but the longer term horizon suggests a dip in allocation until recently.
How much goes to Business Operations?
This next grouping is focused on costs associated with running the businesses that connect producers to consumers; the intermediaries, essentially.
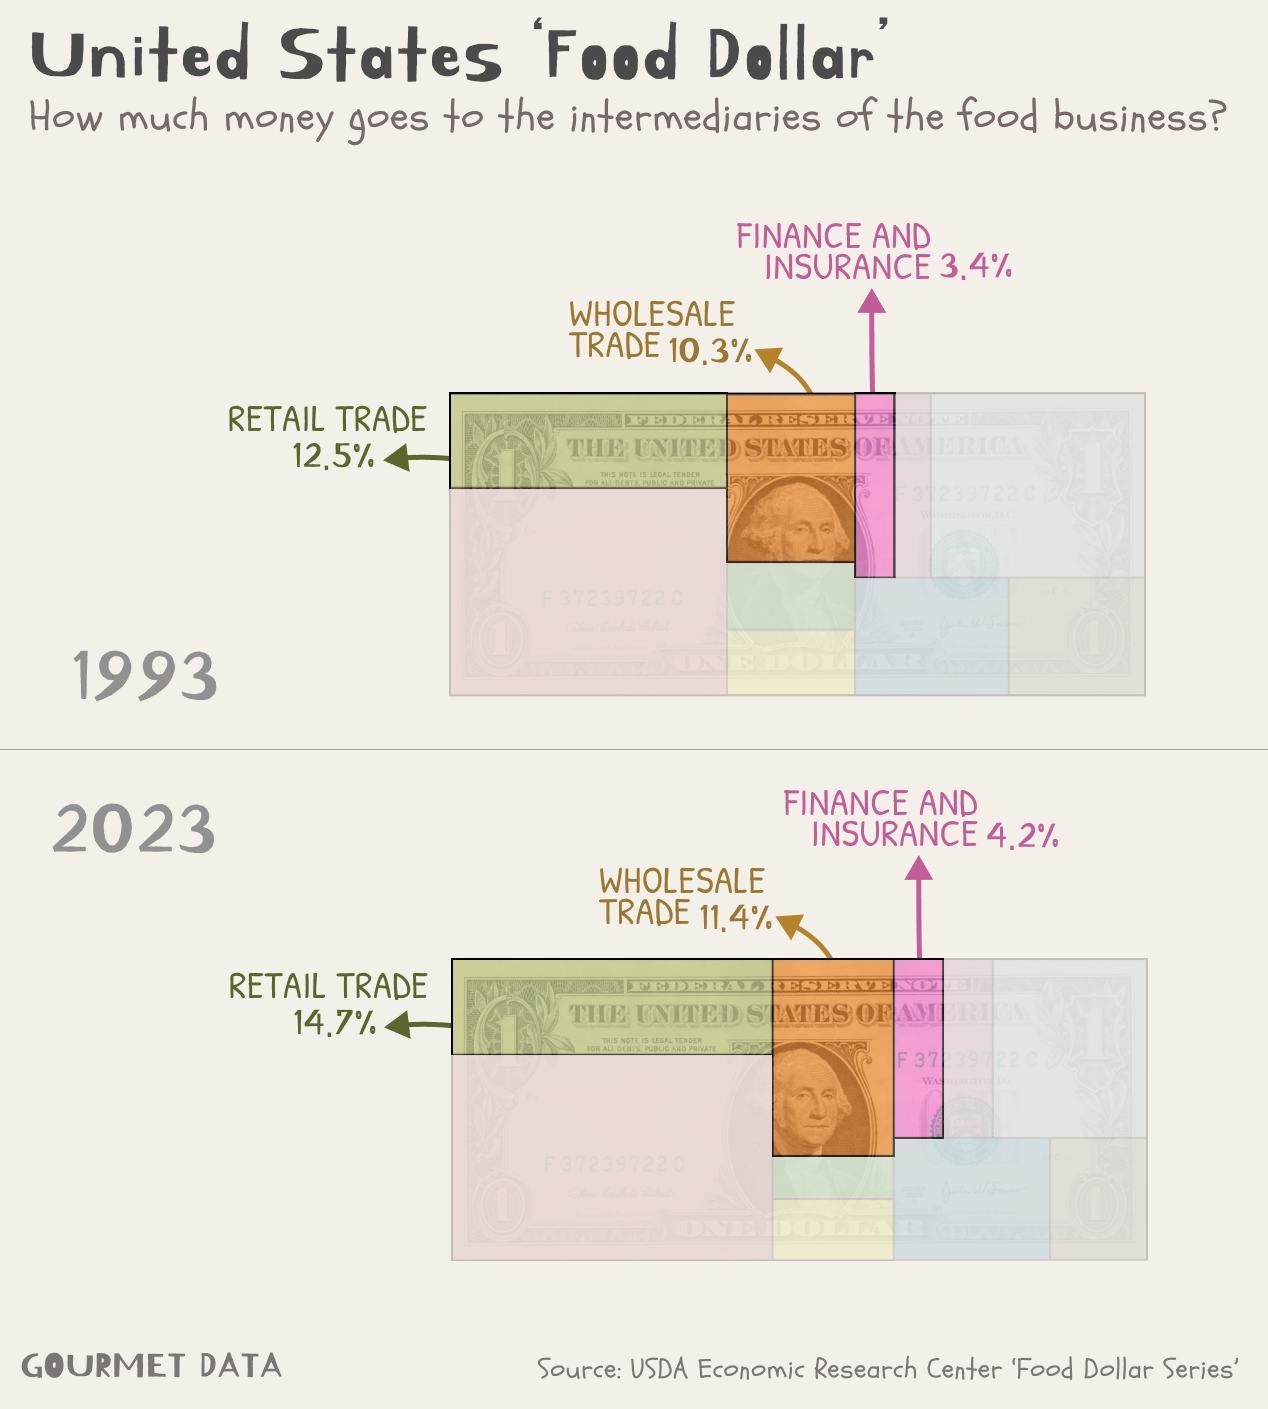
Wholesale trade involves the costs of distribution between processors and retailers or food services (distributors, warehousing, logistics, etc). It's had a steady increase since 1993, as have retailers and insurers.
Retail trade represents the operational costs of grocery stores, supermarkets, and other specialty outlets. This is specifically separate from the food service industry, but does include employee wages of workers in those stores. All the costs associated with these stores are the reason why a loaf of bread at a grocery store and its cost at wholesale.
Insurance should be self-explanatory: crop insurance for farmers, vehicle insurance for trucking companies, and liability coverage for restaurants.
Unsurprisingly, when compared to 1993's numbers, we can see a steady increase in costs for the three categories in this grouping. One can assume the trend that more of the profit seems to be flowing to the distributors rather than the producers.
How much goes to the Food Service Industry?
The biggest increase of share of the food dollar goes to the food service industry.
Food services include all costs associated with preparing and serving food outside the home. This ranges from labor (chefs, servers) to utilities and food ingredients in restaurants or catering services.
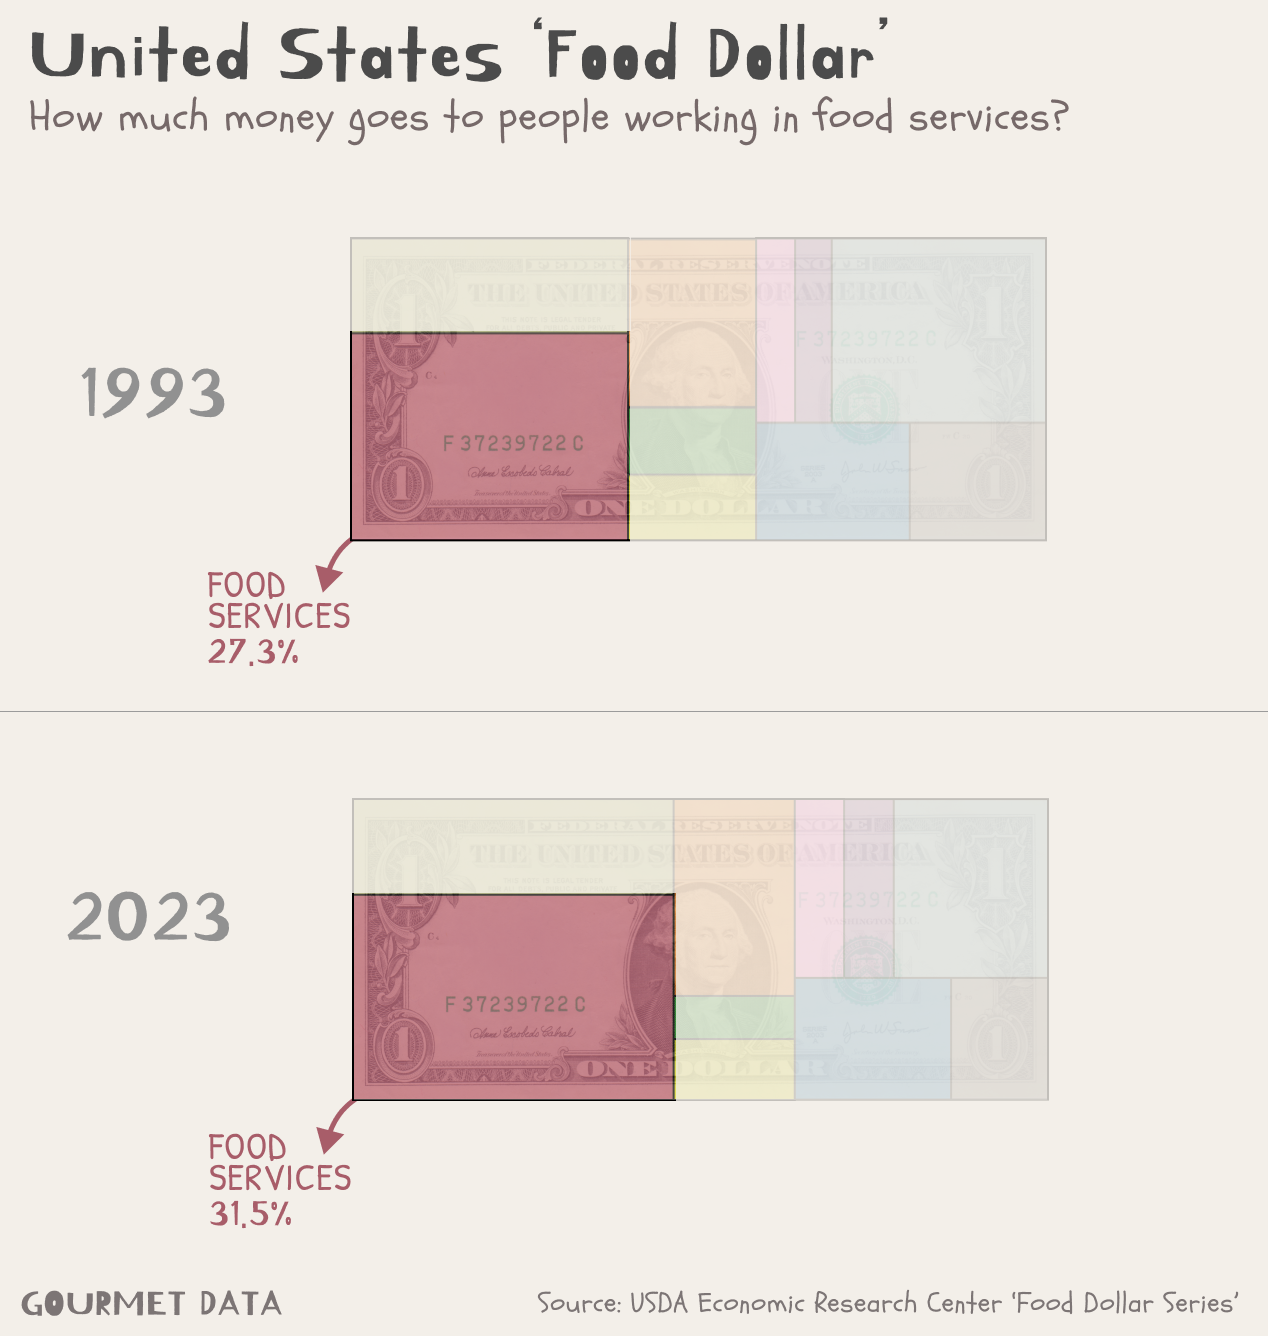
Since the 90s - and even longer before then - Americans have thoroughly embraced convenience culture, and many more people have eaten out many more times than they've been doing. The growth of fast-food chains and casual dining spots in suburbs and cities undoubtedly helped cause this increase. And that isn't even doing a full investigation into takeout and delivery; but again, a topic for a different blog.
Overhead and Support Costs
These are indirect but essential costs that ensure the smooth functioning of the food supply chain. It's a bit of a catch-all category that includes anything from property taxes to regulatory compliance to advertising. It's generally decreased in its share of the food dollar.
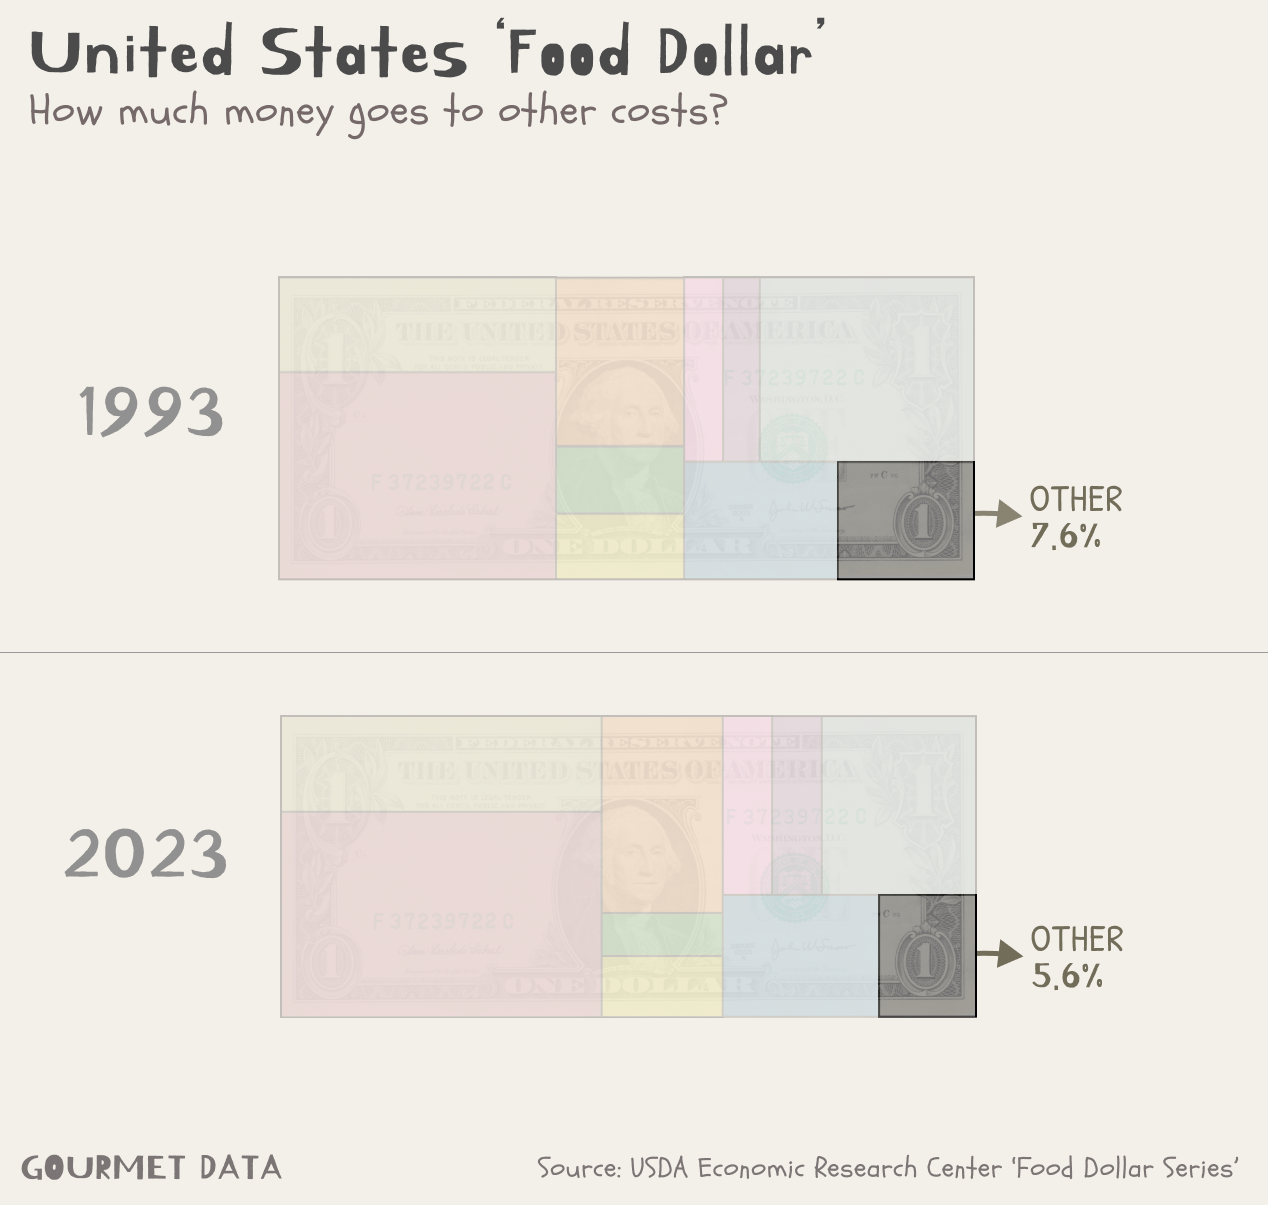
Ultimately, the food dollar is an observational tool, and what I'm observing is a clear winner in the food industry; those serving food to people away from home. I hate moralizing observations, so I'll leave simply on the note of this graph, which shows how, since the 90s, food away from the home has been overtaking food served at home for a while now.
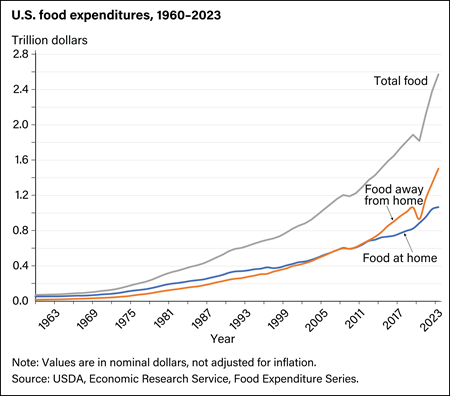
The 21st century is off to a fascinating start.