Charting Crop Prices Over the Years (WIP)
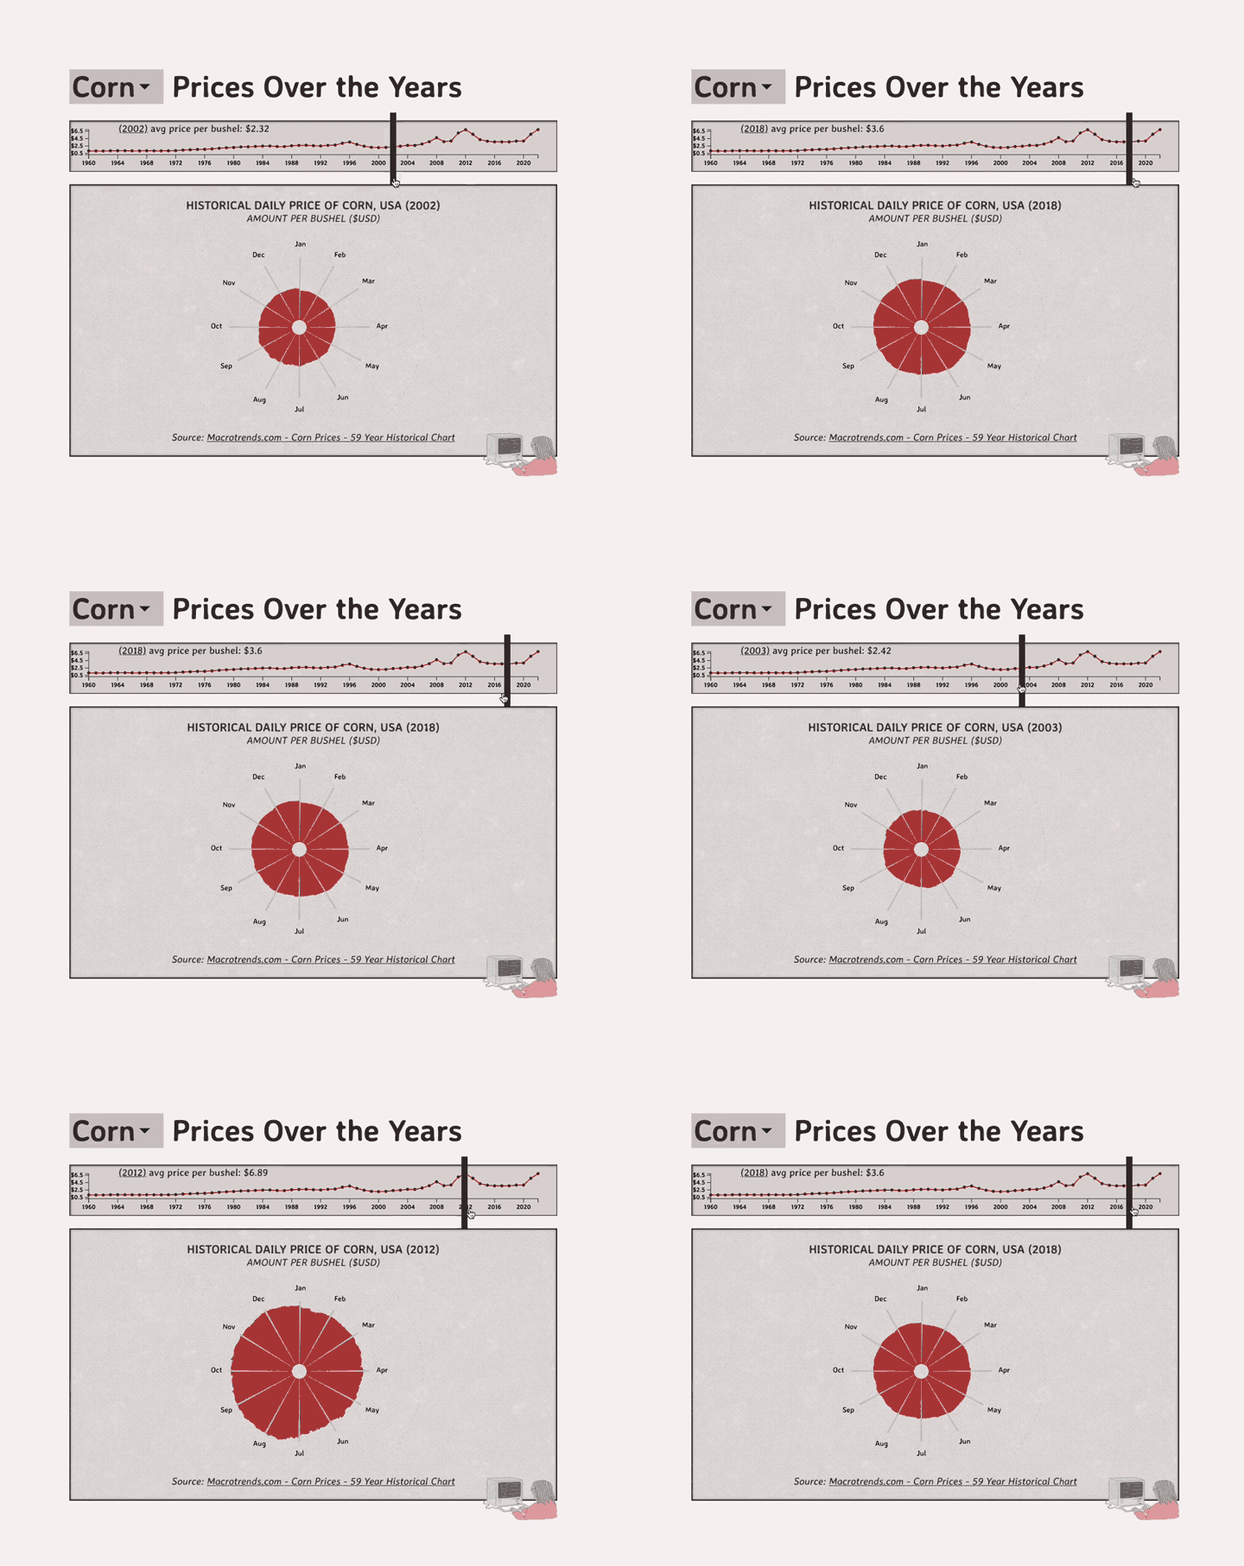
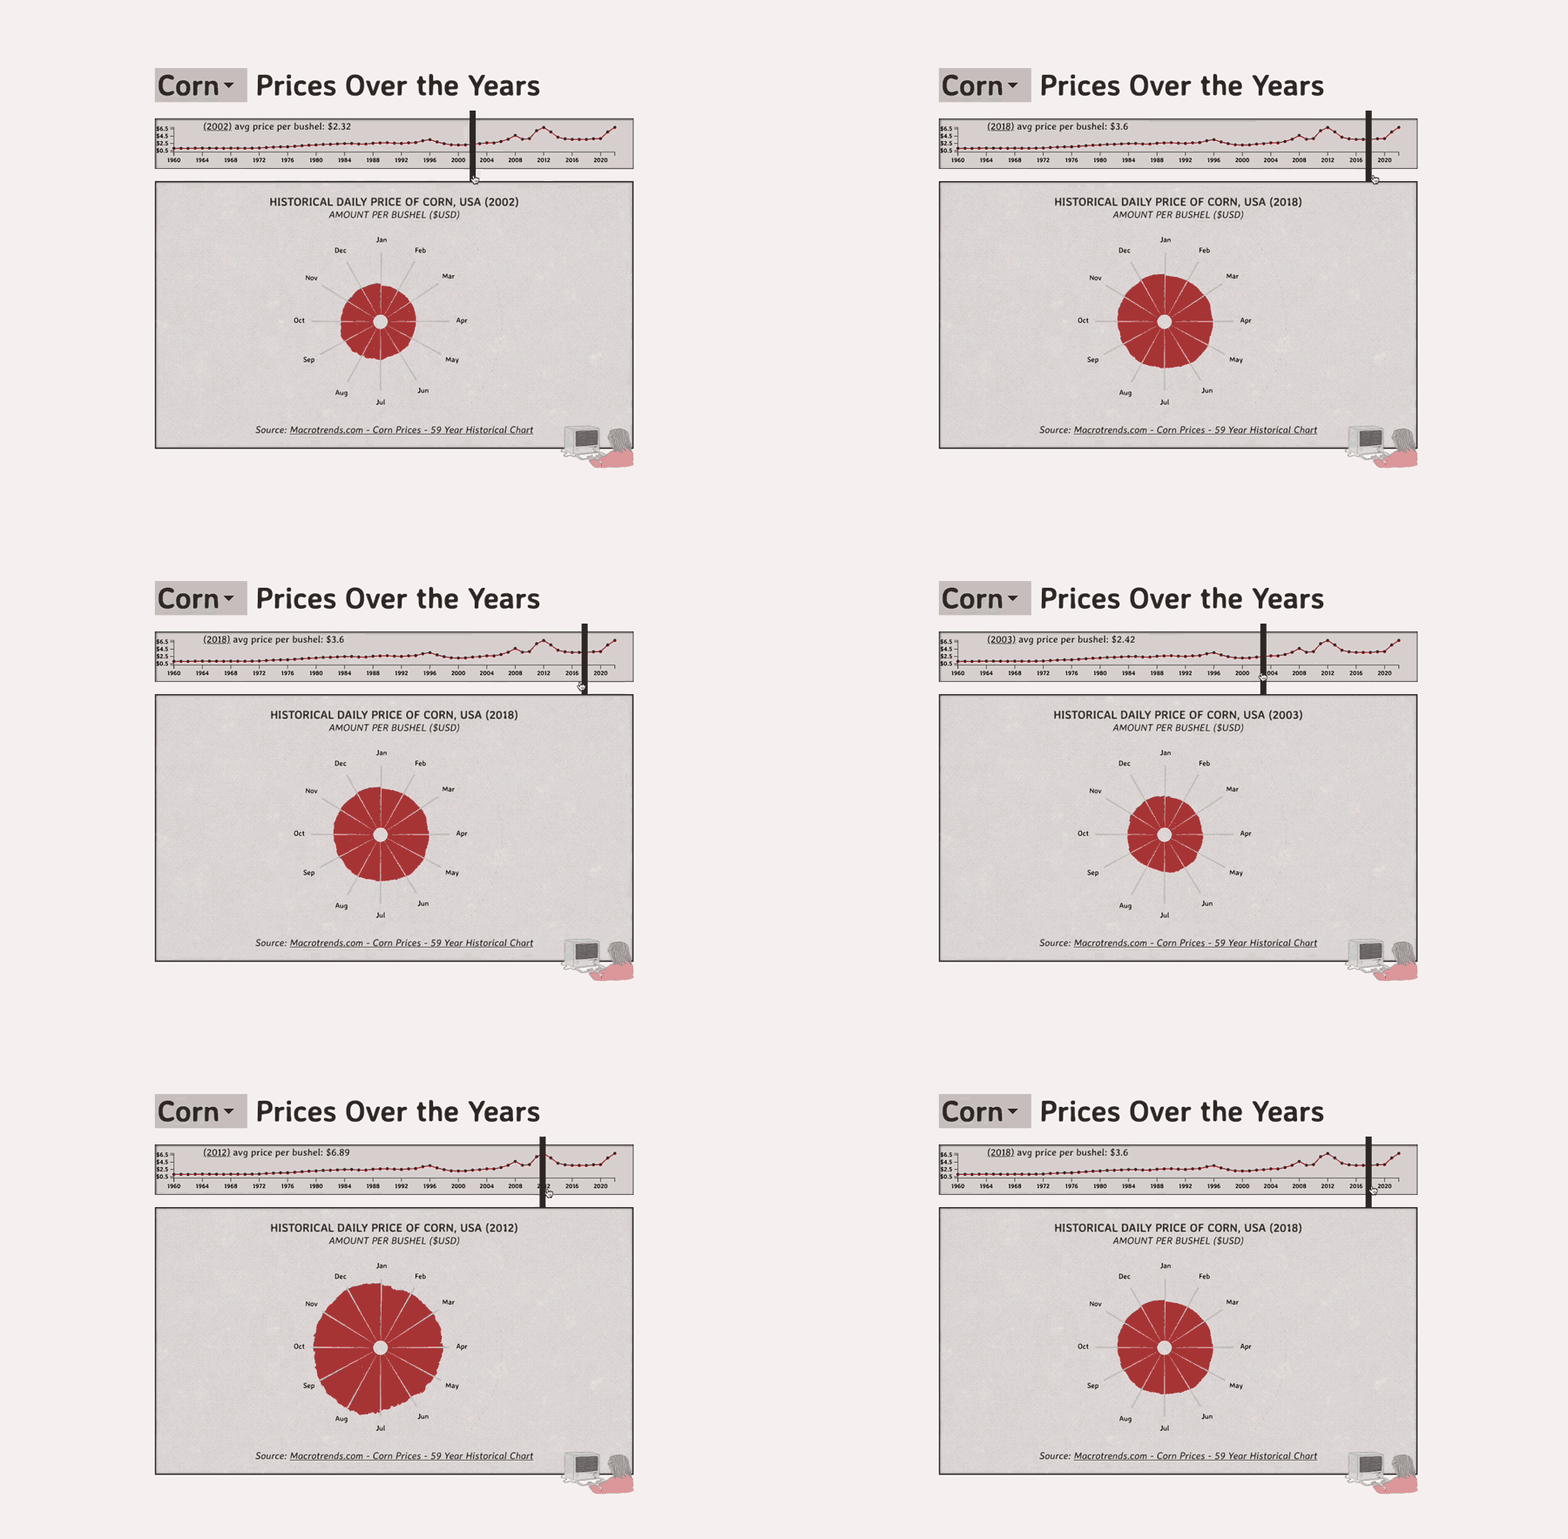
If you didn't know yet, corn is America's jam; most of our food is high fructose corn syrup, and the corn lobby is known for its strength.
Corn has seen its prices fluctuate significantly over the decades. These changes have been influenced by various factors, from economic crises to global pandemics, so I wanted to go through a journey of corn, and some of the other crops, as a brief summary of US history.
Prices Over the Years
HISTORICAL DAILY PRICE OF CORN, USA (1968)
AMOUNT PER BUSHEL ($USD)The Early Years (1960-1970)
In the 1960s, corn prices were relatively stable, hovering around $1.14 to $1.20 per bushel. This stability was largely due to consistent agricultural practices and minimal global disruptions. However, as we moved into the 1970s, prices began to rise steadily, reaching $2.00 by 1979.
This period was marked by Jimmy Carter's presidency, including the oil crisis, which indirectly impacted agricultural costs and prices, and often holds a spot in history as a pretty bad recession between the two big ones (Great Depression and Great Recession).
The 1980s: A New Era of Agriculture
The 1980s introduced advancements in agricultural technology, which initially kept prices stable around the $2.00 range, with minor fluctuations. However, towards the end of the decade, the market saw a slight uptick, reaching $2.63 in 1989, due to increasing production costs and changing market demands.
The 1990s experienced more volatility, with prices peaking at $3.55 in 1996 before dropping to $2.05 in 2000. This decade was characterized by economic reforms and globalization, which brought about new market dynamics and competition.
Periods of Crisis
One of the most notable spikes occurred during the 2008 financial crisis, where corn prices skyrocketed to $4.71. Looking at the line graph used for the key, it's pretty stark seeing how dramatic the increase in price was, and how, ever since, prices haven't really fallen back to their pre 2008 levels.
The 2010s: Climatic and Economic Challenges
The 2010s brought new challenges. In 2011, prices surged to $6.01, and in 2012, they peaked at $6.89. This was due to a combination of factors, including droughts in major corn-producing areas and increasing demand for biofuels. By the mid-2010s, prices began to decline, stabilizing around $3.60 to $3.80.
The 2020s: The Impact of COVID-19
More recently, COVID in 2020 had a profound impact on global economies, including the corn market. Prices in 2020 were $3.83, slightly higher than previous years due to supply chain disruptions. However, by 2021, prices jumped to $5.66 and further to $6.92 in 2022, driven by supply chain issues - no doubt exasperated by the Ukraine-Russian war - increased demand, and economic uncertainty caused by the pandemic.
Conclusion
Corn prices have experienced significant fluctuations over the decades, influenced by economic crises, technological advancements, climatic conditions, and global events like the COVID-19 pandemic. Understanding these changes is crucial for farmers, investors, and policymakers to navigate the future of agricultural markets effectively. As we move forward, monitoring these factors will be essential in predicting and managing the future trends in corn prices.

