The link between Omega-3 and Omega-6 Ratios

I've written about fats before, but I wanted to do a thorough walkthrough of some of my analysis work. I'll talk about how I created the image above.
As one of the three macronutrients we get from food, fats should make up about 30% of our diet (maybe more for me, cuz I love butter). But I do want to live a long life, so it wasn't long before I asked myself if there was a definitive way to rank the cooking fats and oils, like olive oil, butter, ghee, etc.
Before getting into the full behind-the-scenes, I'll list out what my predictions are:
- nutrition is subjective and messy, so I probably won't get a definitive answer to say X is better than Y
- the difference between saturated fat vs unsaturated fat is easily measurable in these food items, and has a clear difference in health outcomes, so I plan to spend a big part of my analysis on this
Let's begin.
Gathering the Data
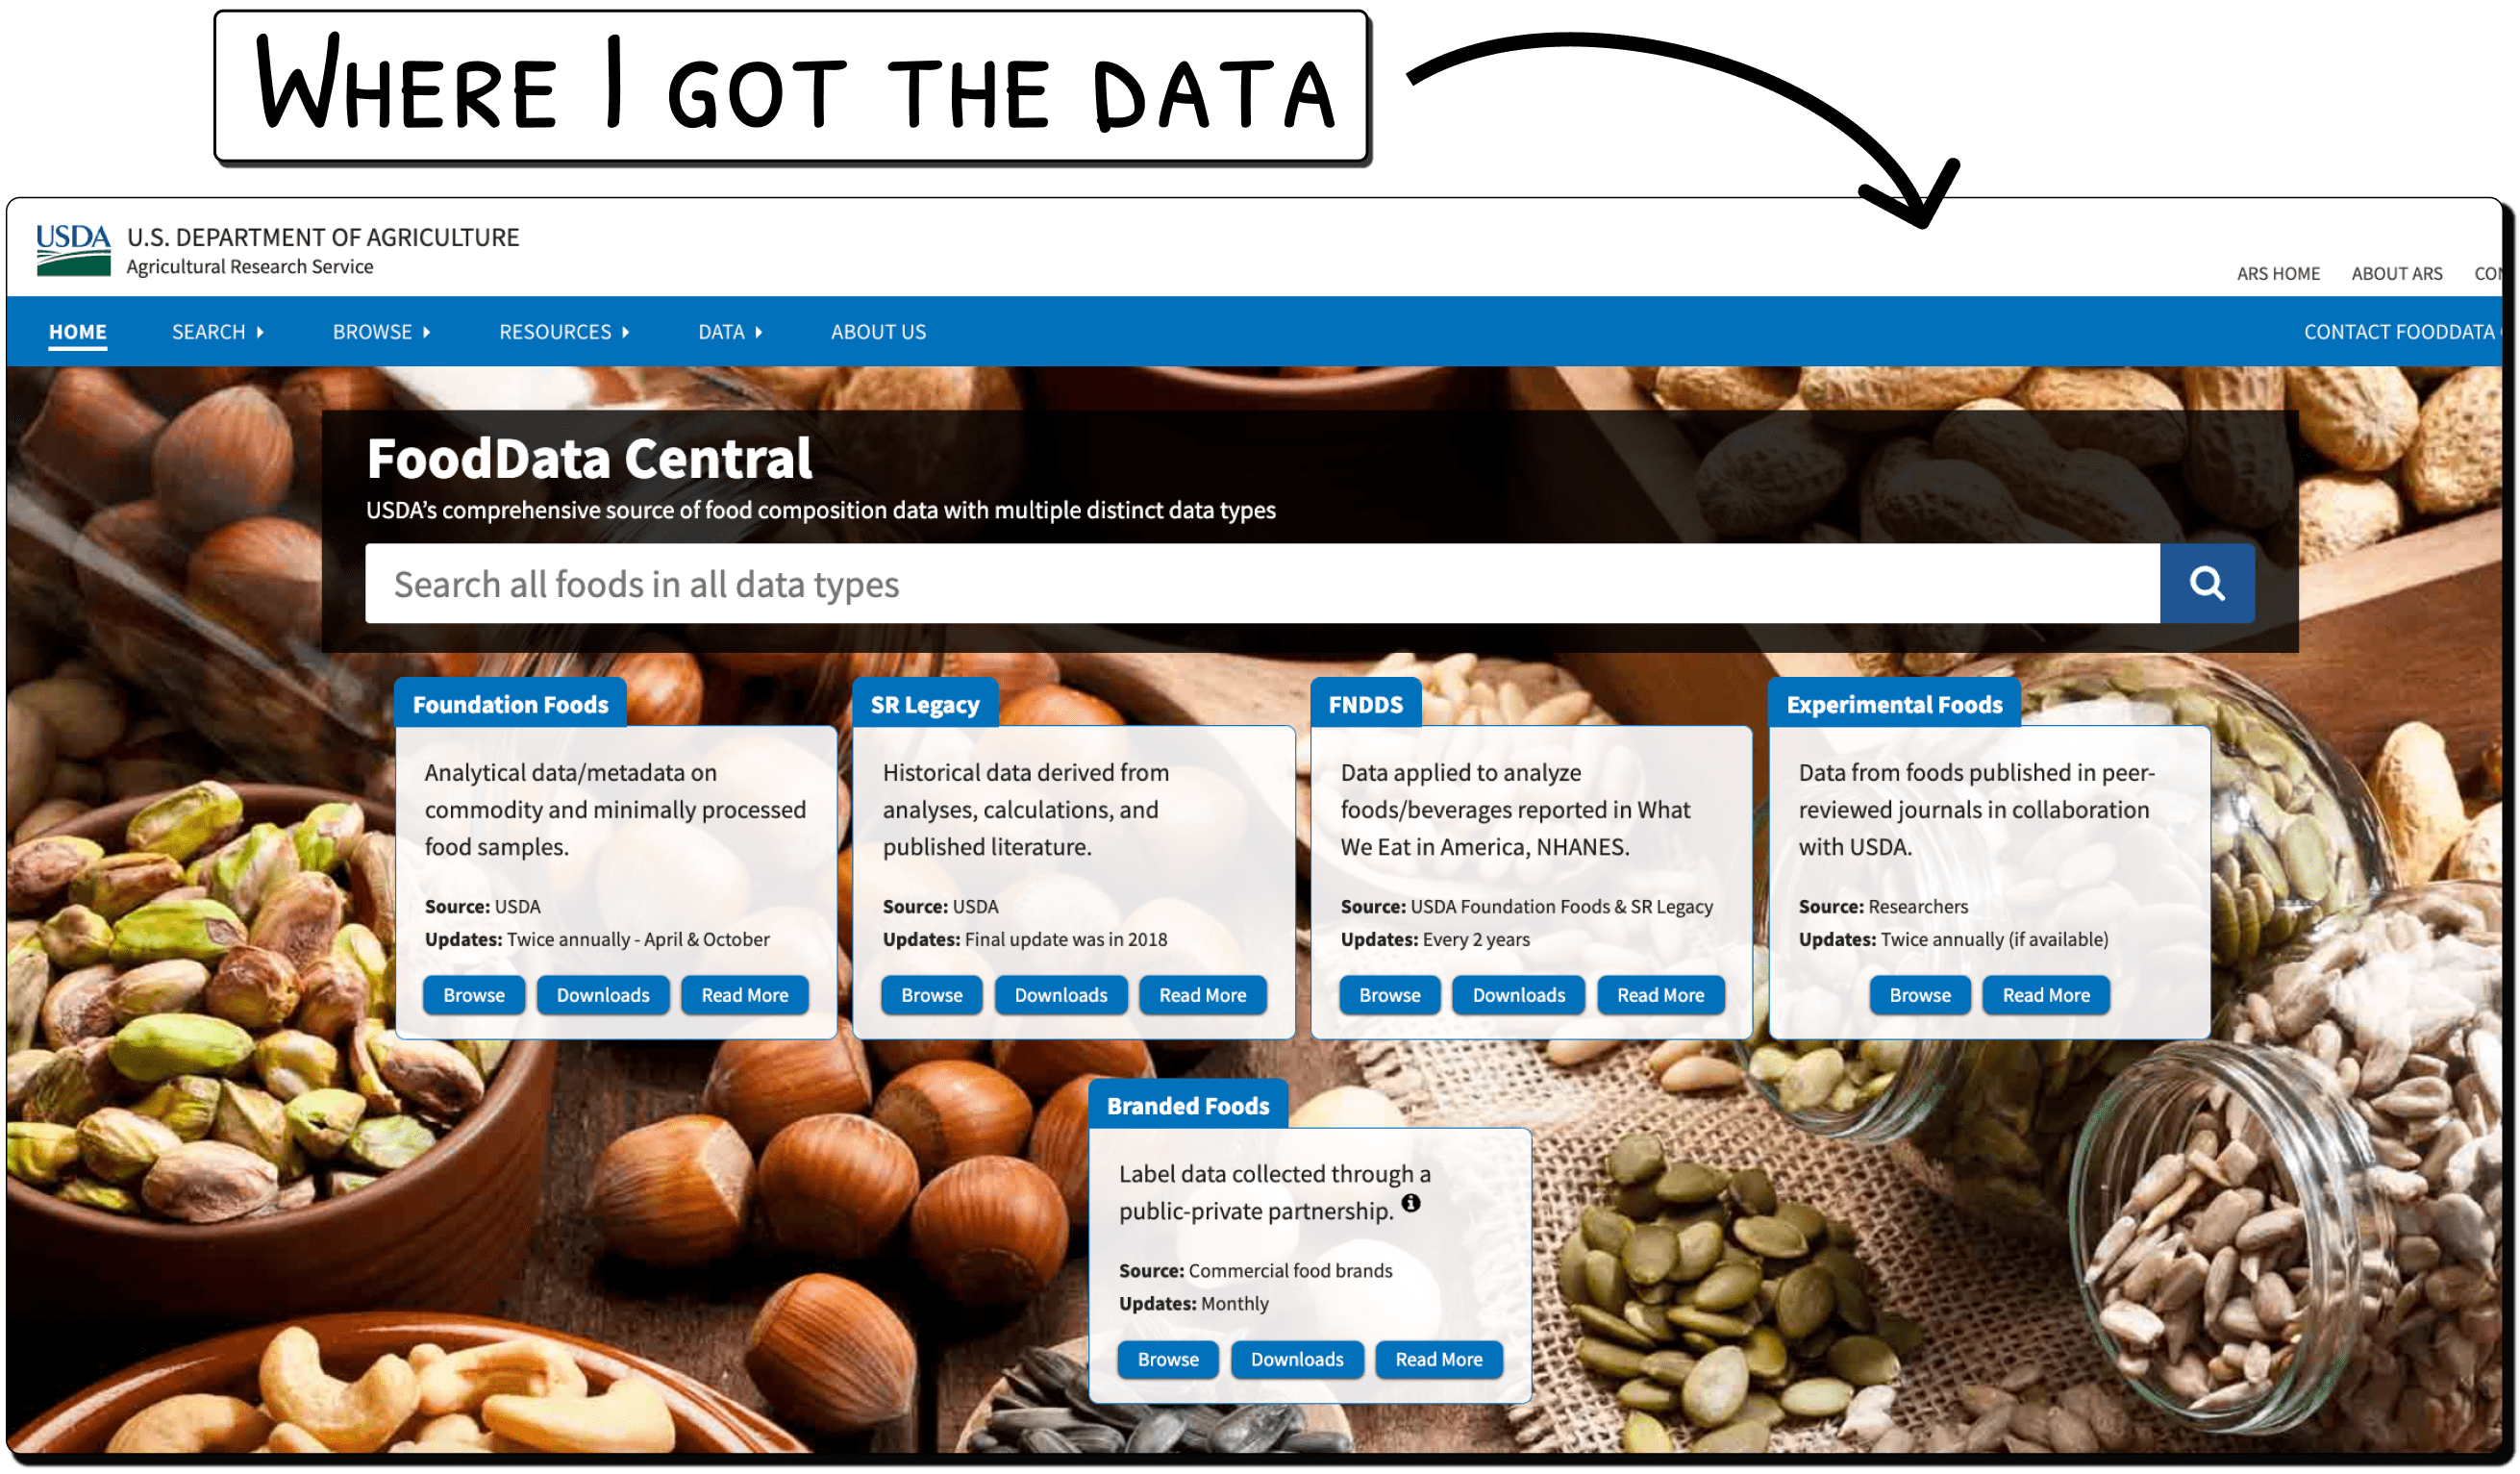
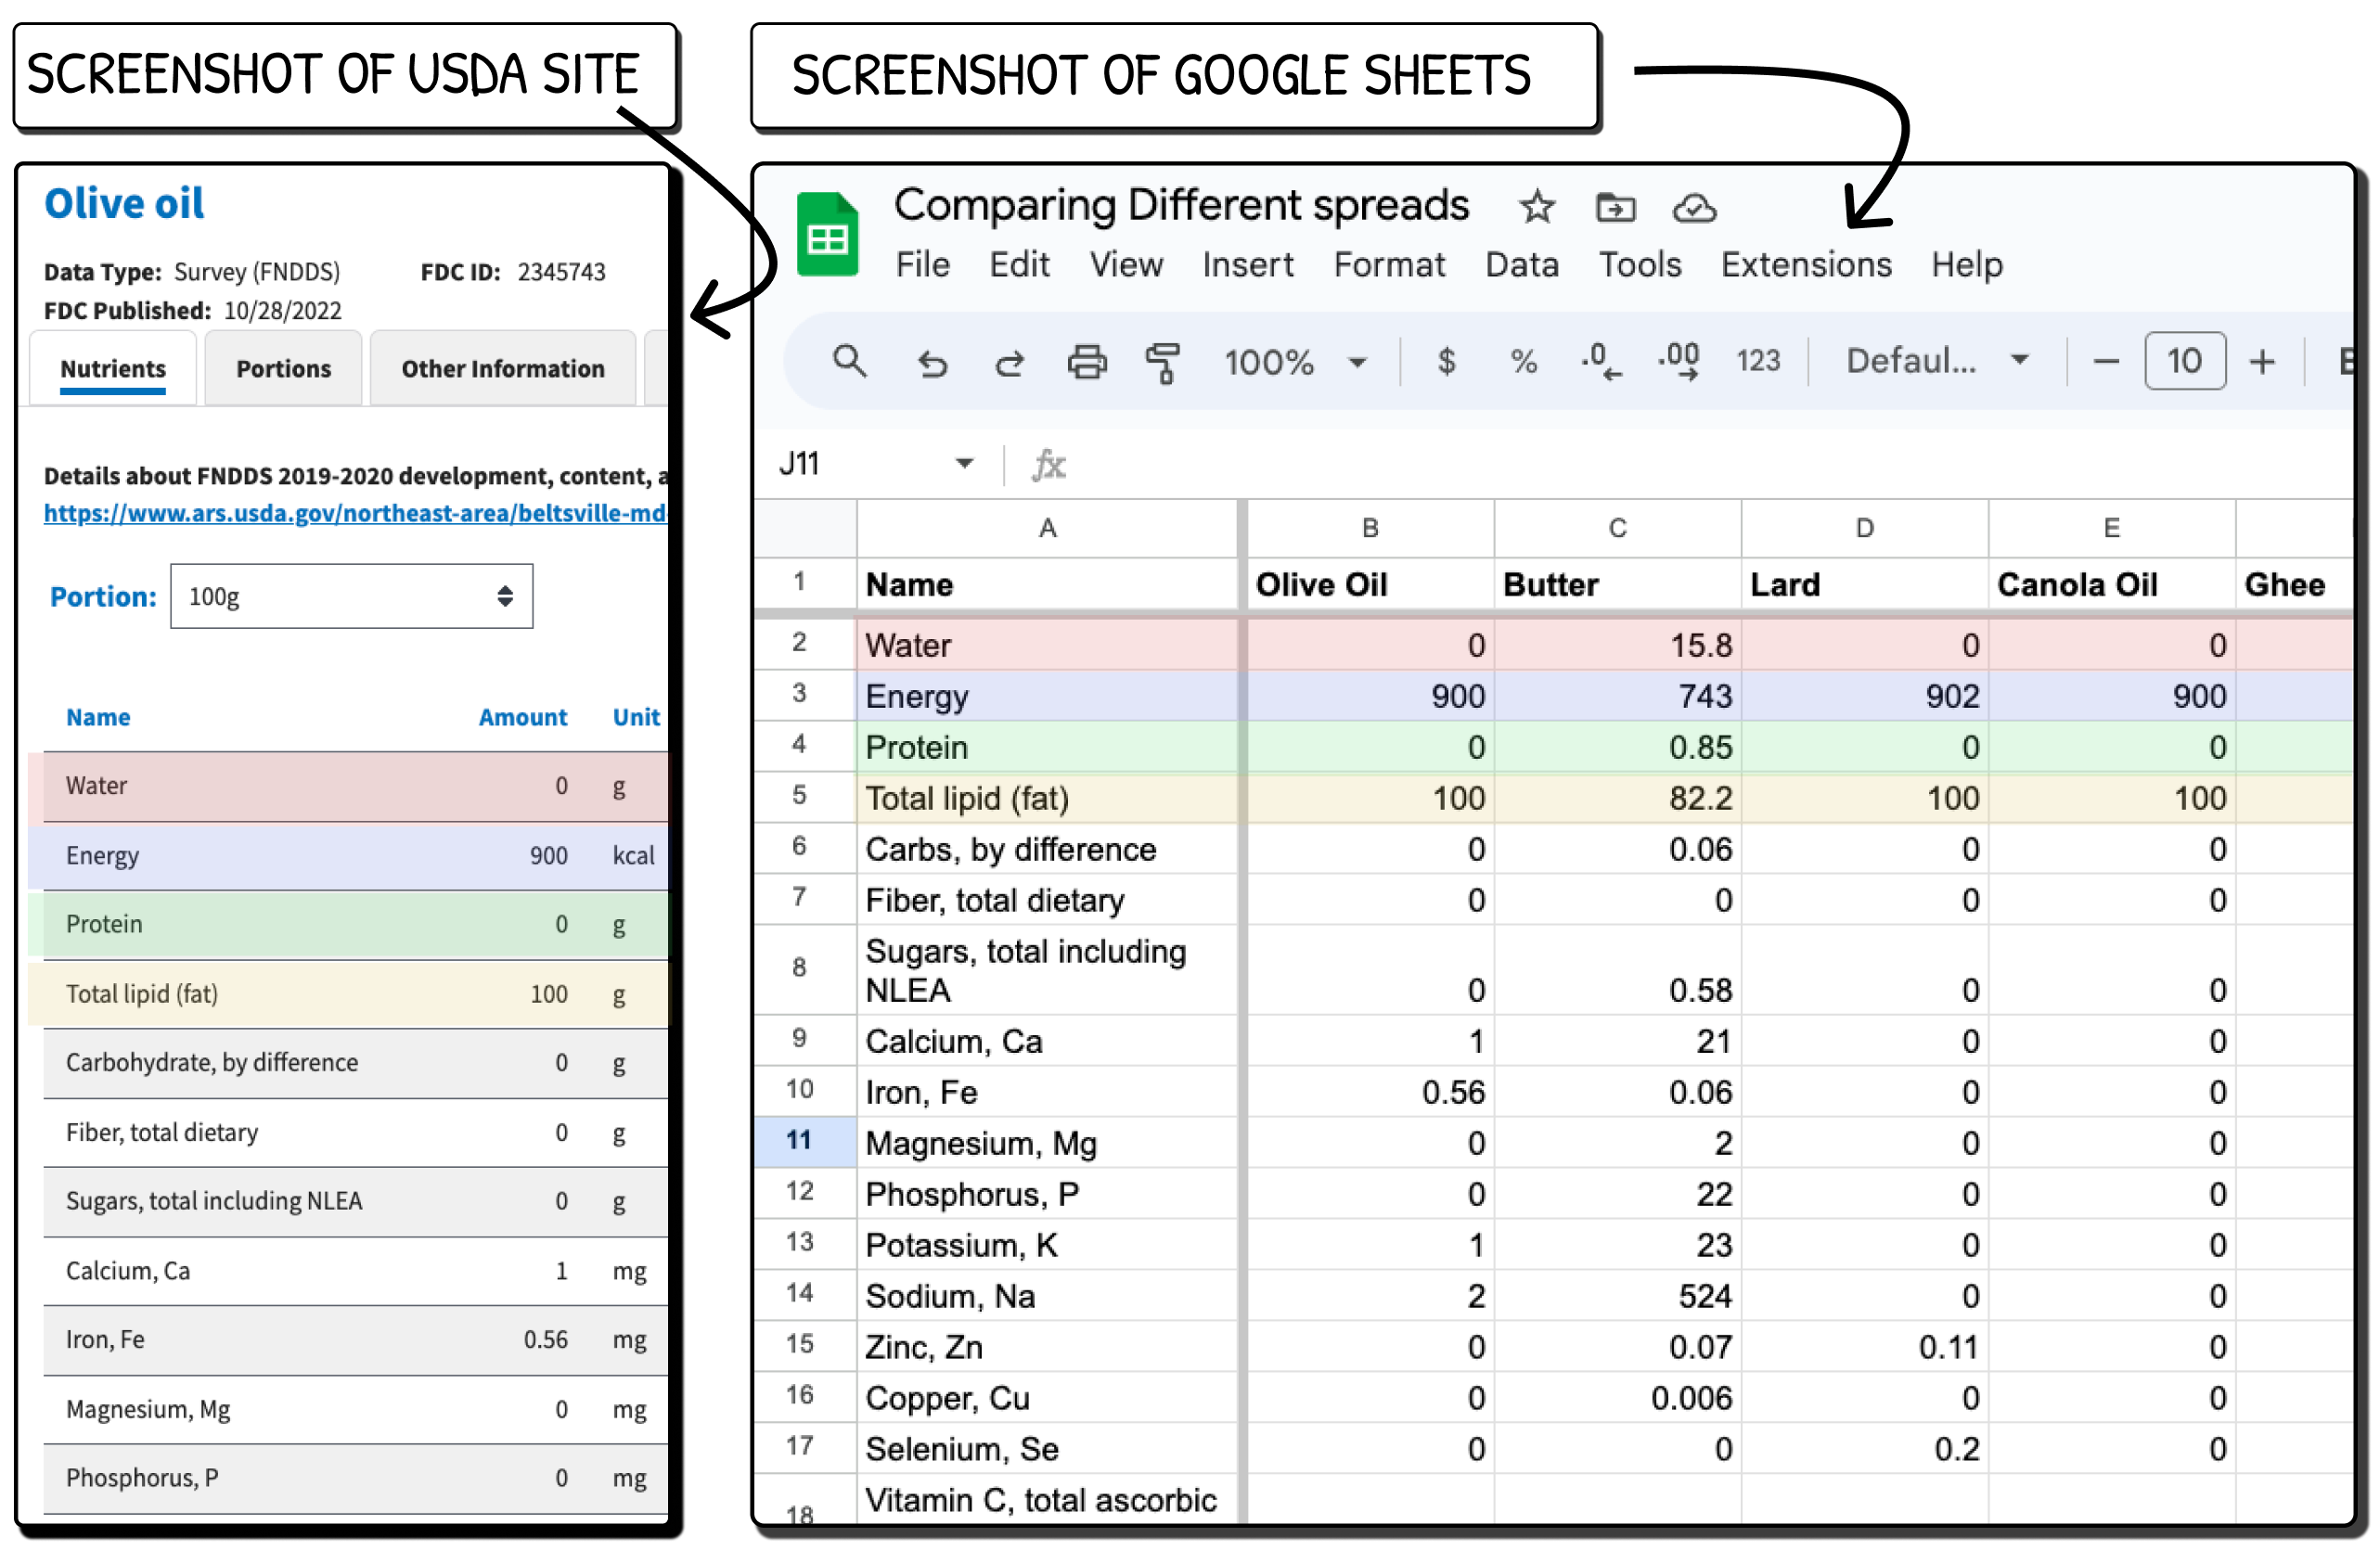
I write about food a lot, and I tend to go with the USDA FoodData database. It has several sub-databases, each with hundreds to thousands of food items. We'll use only the FNDDS numbers for our analysis to make sure each of the fats and oils in our analysis comes from a common source.
I decided to collect data on macronutrients (fat, protein, carbs), types of fat (saturated, unsaturated, trans fat), vitamins, and minerals. You can see the entries for olive oil, canola oil, butter, lard, etc, and the screenshot below shows what happened when I put it in Google Sheets.
Filtering Out the Non-Important Stuff
In my experience, it helps to go into analysis with a goal in mind, and to only focus on the data points related to that goal. For me, that goal is to compare different types of fats against each other. I don't need too much insight on things like protein amounts or fiber (maybe later).
I skimmed a few research studies to get a gauge on what people talked about when talking about the health impacts of fats, and I tried my best to get the main concerns when it comes to overconsumption of fats:
- cardiovascular health (types of fats determine health benefits and consequences)
- cholesterol levels (saturated/trans fat raise 'bad cholesterol', unsaturated fats raise 'good cholesterol'
- weight management (9 calories per gram)
- inflammation (trans fat and saturated fats)Omega-3 fatty acids are anti-inflammatory, while Omega-6 fatty acids can promote inflammation when consumed in excess, so the ratio is important)
Taking this list, I settled on the following variables to record from the dataset
- Total lipid (fat)
- Fatty acids, total saturated
- Fatty acids, total monounsaturated
- Fatty acids, total polyunsaturated
- Cholesterol
- Energy
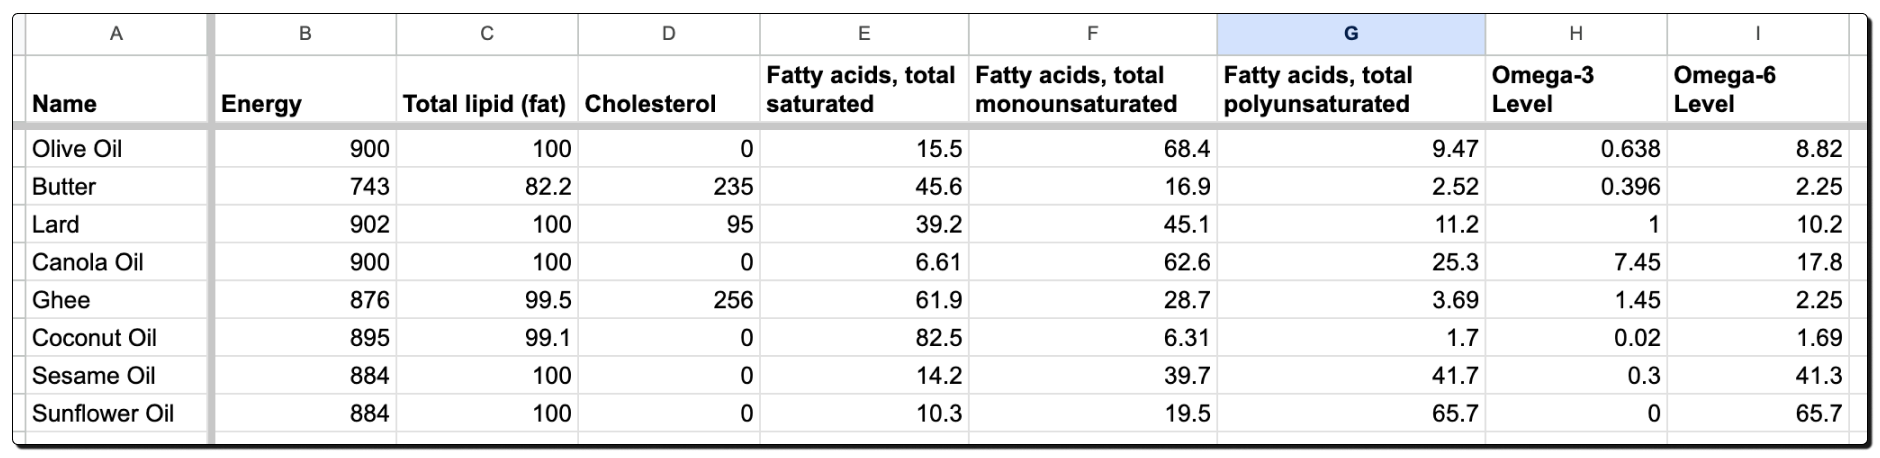
Now, I didn't delete the unnecessary rows, as I've learned early on in my career that keeping the original data is really good for tracing your steps. Rather, I just simply created a new tab in my Google Sheets, and the outcome is the following screenshot.
Adding Some New Features
I now have a list of recorded nutrients that I know I want to compare.
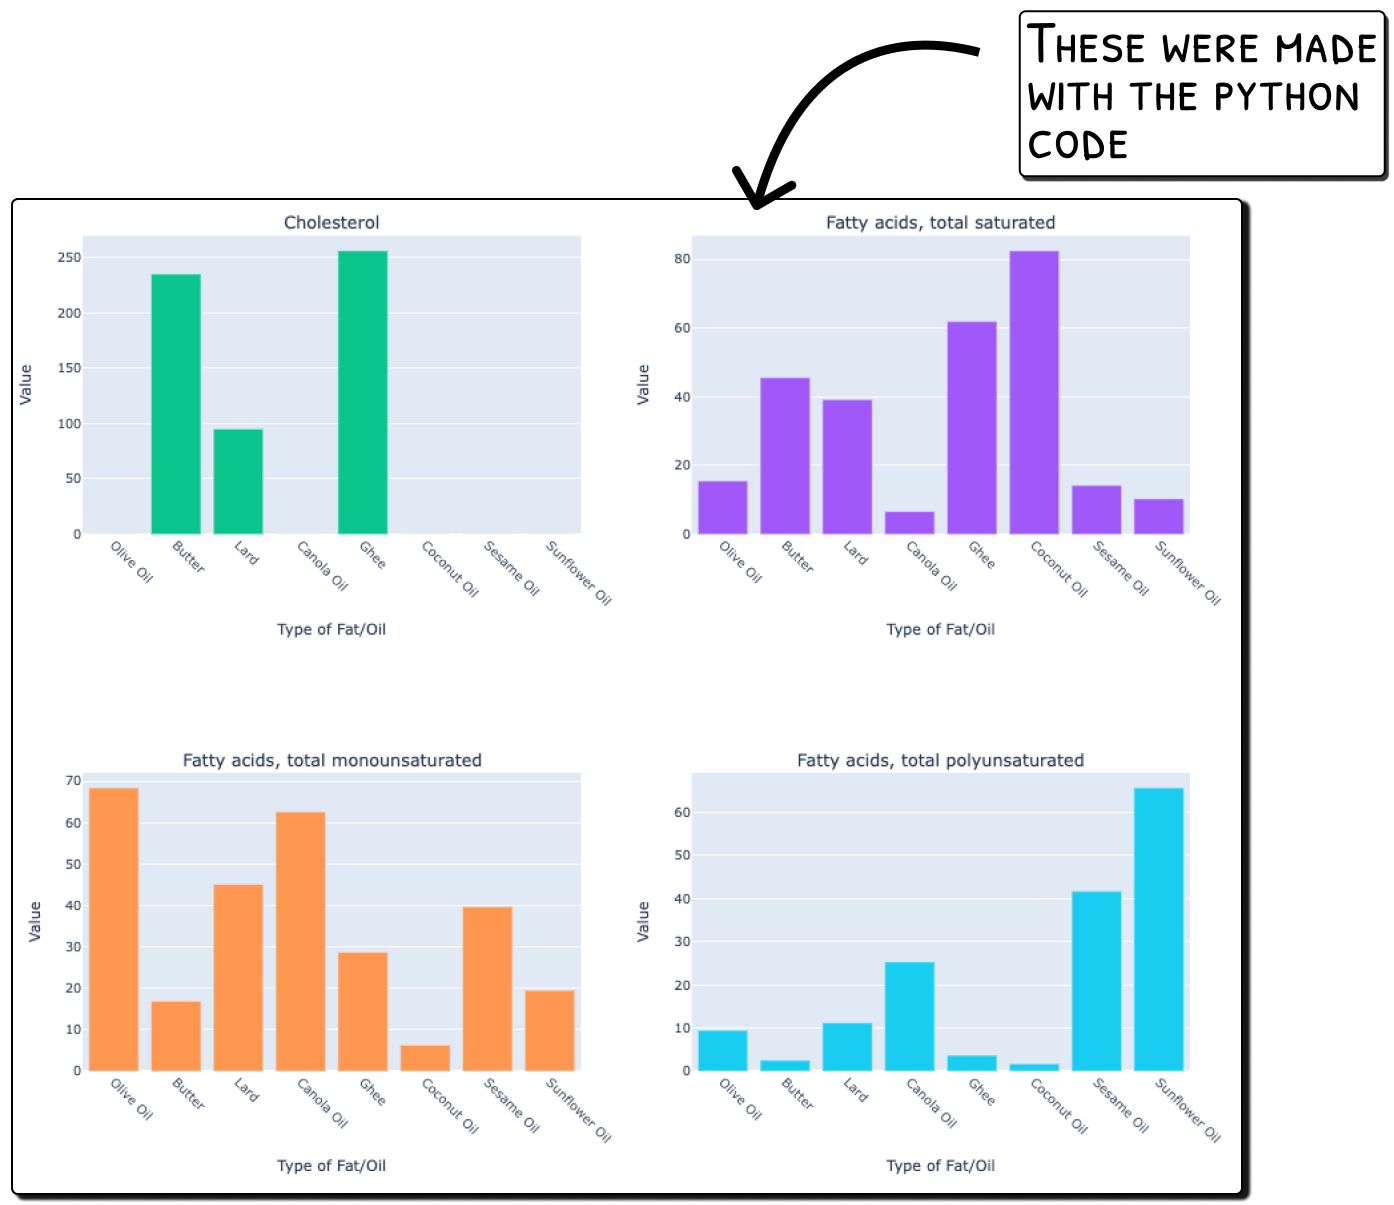
Truthfully, that part isn't really that hard. In this age of AI, we can simply ask Python to create a series of bar charts for each of the variables, and further explore whatever questions that bring up.
import pandas as pd
import plotly.graph_objects as go
from plotly.subplots import make_subplots

# Read the CSV file
df = pd.read_csv('test.csv')

# Set 'Name' as the index
df.set_index('Name', inplace=True)

# Transpose the dataframe
df_transposed = df.transpose()

# Create subplots
fig = make_subplots(rows=4, cols=2, subplot_titles=df_transposed.columns)

# Add bar traces for each variable
for i, column in enumerate(df_transposed.columns, 1):
    row = (i - 1) // 2 + 1
    col = (i - 1) % 2 + 1

    fig.add_trace(
        go.Bar(x=df_transposed.index, y=df_transposed[column], name=column),
        row=row, col=col
    )

# Update layout
fig.update_layout(
    height=1200,
    width=2000,
    title_text="Nutritional Content of Various Oils and Fats",
    showlegend=False
)

# Update y-axes
fig.update_yaxes(title_text="Value")

# Update x-axes
fig.update_xaxes(title_text="Type of Fat/Oil", tickangle=45)

# Show the plot
fig.show()
The above code gives me the following bar graphs, which is already helpful enough. For instance, looking at cholesterol, I can clearly see the difference between the oils and the animal fats.
How can we make our analysis better? Can we compare nutrients to each other? In my case, should I sacrifice my weight management (measured by kcal) to allow for a better omega-3: omega-6 ratio? A lot of this depends on the person, but I figured I could try to answer this question by coming up with my own features.
To calculate the omega-3 and omega-6 levels from the given data, there's a list of specific polyunsaturated fatty acids (PUFAs) that are omega-3 and omega-6 fatty acids (good thing we kept the original data).
Omega-3 Fatty Acids:
- Alpha-Linolenic Acid (ALA, PUFA 18:3)
- Eicosapentaenoic Acid (EPA, PUFA 20:5 n-3)
- Docosapentaenoic Acid (DPA, PUFA 22:5 n-3)
- Docosahexaenoic Acid (DHA, PUFA 22:6 n-3)
Omega-6 Fatty Acids:
- Linoleic Acid (LA, PUFA 18:2)
- Arachidonic Acid (AA, PUFA 20:4)
To find the omega-3 and omega-6 levels, you sum the relevant PUFA values. The ratio of omega-3 to omega-6 is then calculated by dividing the total omega-3 content by the total omega-6 content. Lots of Western diets today are about 1:15, while historically is was about 1:1.
Thus, for our new features, we would consider the following:
- Saturated Fat Ratio: We'll be looking for a low number here, as Lower Saturated Fat Ratio is generally considered healthier. For the unsaturated fat ratios, we'll want higher numbers there.
- Omega-3 to Omega-6 Ratio: (PUFA 18:3 + PUFA 20:5 + PUFA 22:5 + PUFA 22:6) / PUFA 18:2. These are essential fatty acids with various health benefits, but their ratio is important (ideally close to 1:1 or 1:4).
- Cholesterol Density: Cholesterol / Total lipid. Lower Cholesterol Density is generally preferred for heart health.
- Energy Density: Energy / Total lipid. Lower Energy Density can be beneficial for weight management
These features are decent for getting a better analysis, so I wrote some code to implement them. Luckily, with the original USDA data, we can get the parts and pieces to build out these new features, and do some basic math.
import pandas as pd
import numpy as np
# Load the data
df = pd.read_csv('fat_data.csv')
print(df.columns)
# Function to calculate ratios
def calculate_ratio(numerator, denominator):
return np.where(denominator != 0, numerator / denominator, 0)
# Calculate features
df['Saturated Fat Ratio'] = calculate_ratio(df['Fatty acids, total saturated'], df['Total lipid (fat)'])
df['Monounsaturated Fat Ratio'] = calculate_ratio(df['Fatty acids, total monounsaturated'], df['Total lipid (fat)'])
df['Polyunsaturated Fat Ratio'] = calculate_ratio(df['Fatty acids, total polyunsaturated'], df['Total lipid (fat)'])
# Calculate Omega-3 and Omega-6 levels
df['Omega-3 Level'] = df['PUFA 18:3'] + df['PUFA 20:5 n-3 (EPA)'] + df['PUFA 22:5 n-3 (DPA)'] + df['PUFA 22:6 n-3 (DHA)']
df['Omega-6 Level'] = df['PUFA 18:2']
df['Cholesterol Density'] = calculate_ratio(df['Cholesterol'], df['Total lipid (fat)'])
df['Energy Density'] = calculate_ratio(df['Energy'], df['Total lipid (fat)'])
# Calculate Omega-3 to Omega-6 Ratio
df['Omega-3 to Omega-6 Ratio'] = calculate_ratio(df['Omega-3 Level'], df['Omega-6 Level'])
# Select final features
final_features = ['Name',
'Total lipid (fat)',
'Fatty acids, total saturated',
'Fatty acids, total monounsaturated',
'Fatty acids, total polyunsaturated',
'Cholesterol',
'Energy',
'Saturated Fat Ratio',
'Monounsaturated Fat Ratio',
'Polyunsaturated Fat Ratio',
'Omega-3 Level',
'Omega-6 Level',
'Omega-3 to Omega-6 Ratio',
'Cholesterol Density',
'Energy Density']
# Create new dataframe with engineered features
fat_analysis_df = df[final_features]
# Display results
print(fat_analysis_df)
# Optional: Save to CSV
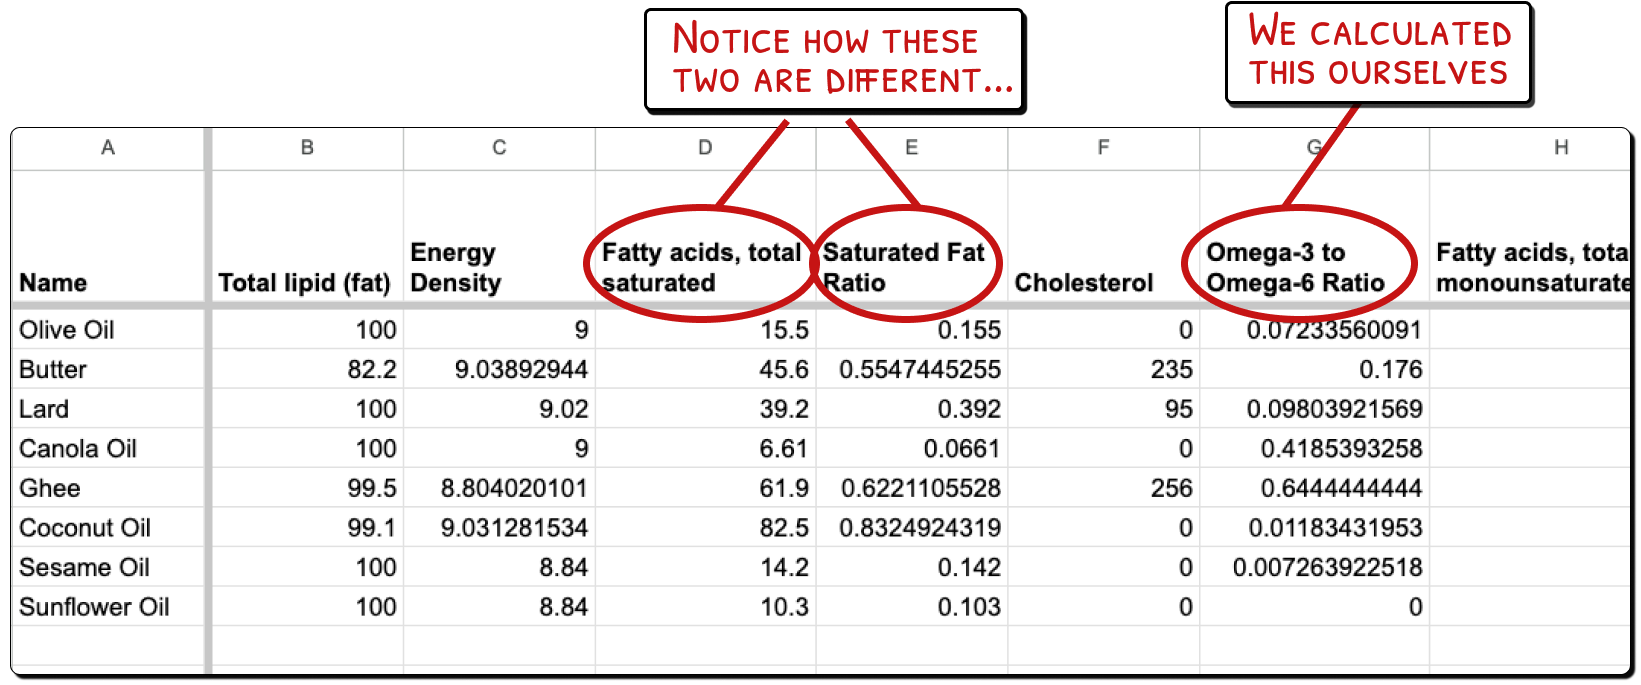
fat_analysis_df.to_csv('fat_analysis_results.csv', index=False)From this analysis, I have this final dataset. And this final dataset is what I will use to visualize the analysis. Using the density of cholesterol and calories felt more accurate, as they're being divided by the total amounts of fat, and account for other things that might be present in these cooking oils. At the end of the day, this is the important deliverable of the analysis.
A Look at the Visual Analysis
I landed on the omega-3 to omega-6 ratio metric because I've been hearing about a recent backlash against seed oils, and an apology to the trend of the past of avoiding saturated fats (eg animal fats) for those same oils.
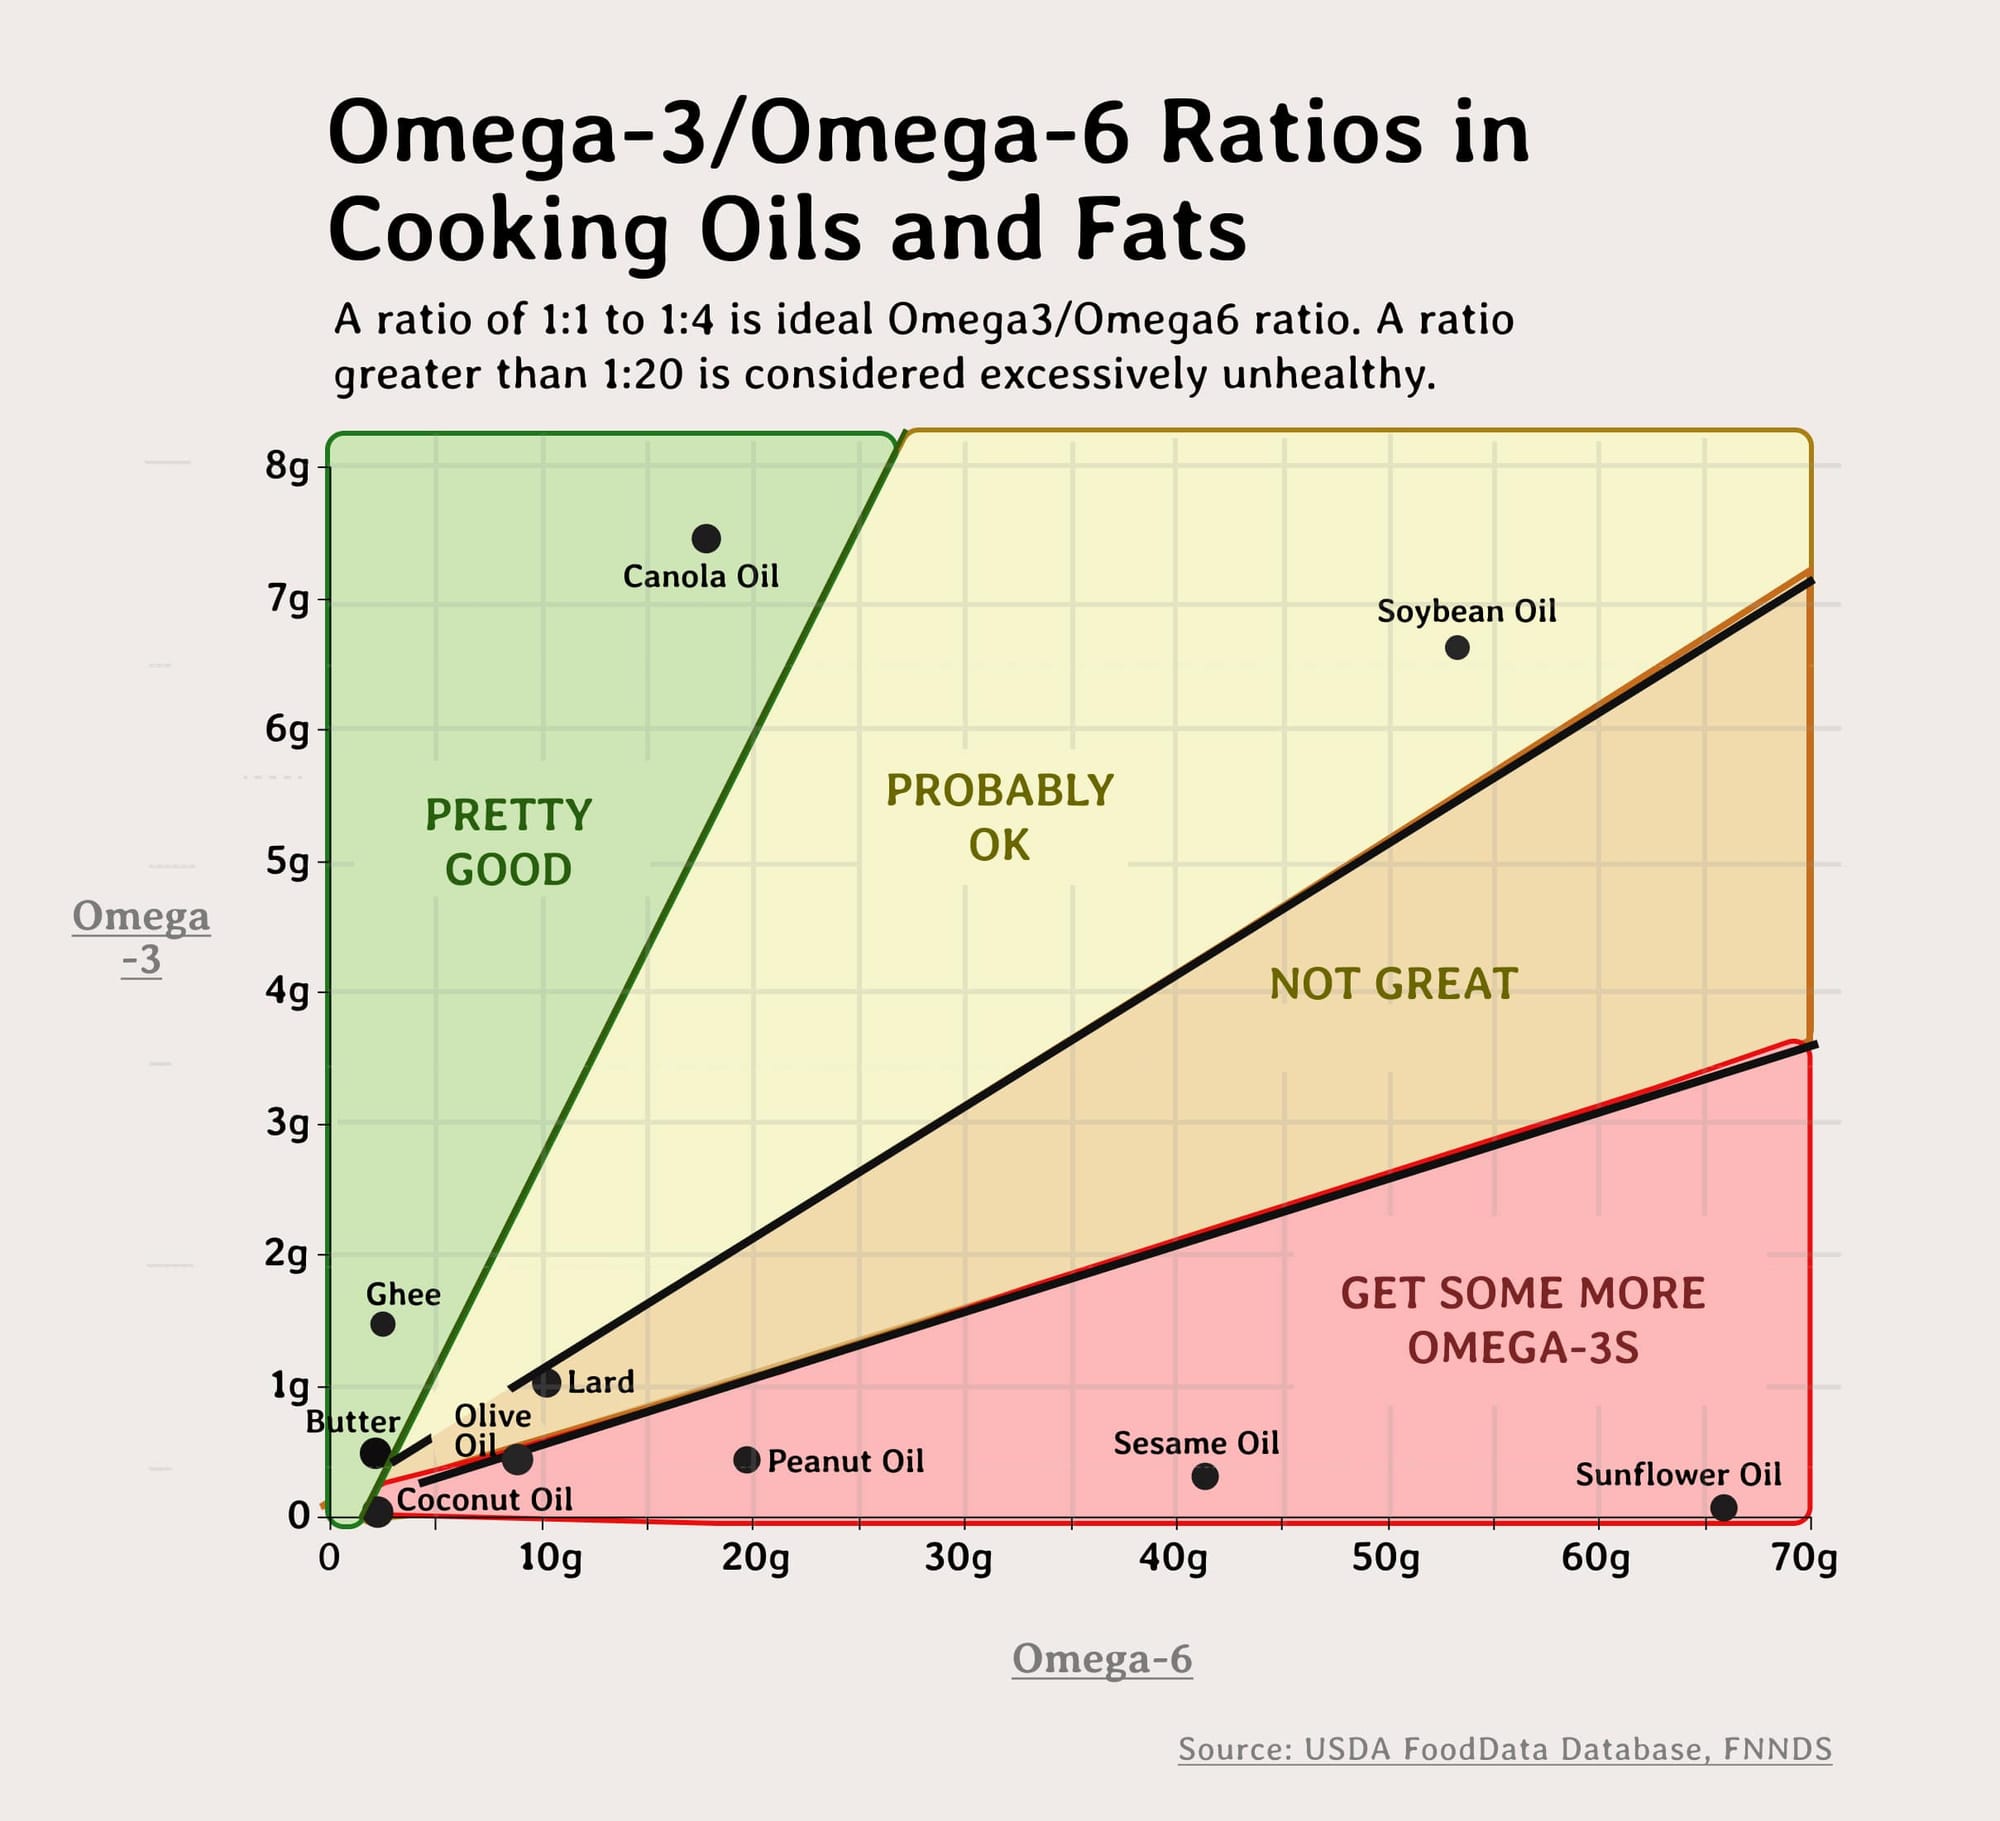
The recommended Omega-3 to Omega-6 ratio ranges from 1:1 to 1:4 because an excessive intake of Omega-6 fatty acids can promote inflammation. This means that for every 1 gram of Omega-3 fatty acids, one should consume no more than 4 grams of Omega-6 fatty acids.
Let's look at the bar graphs related to those two metrics in particular.
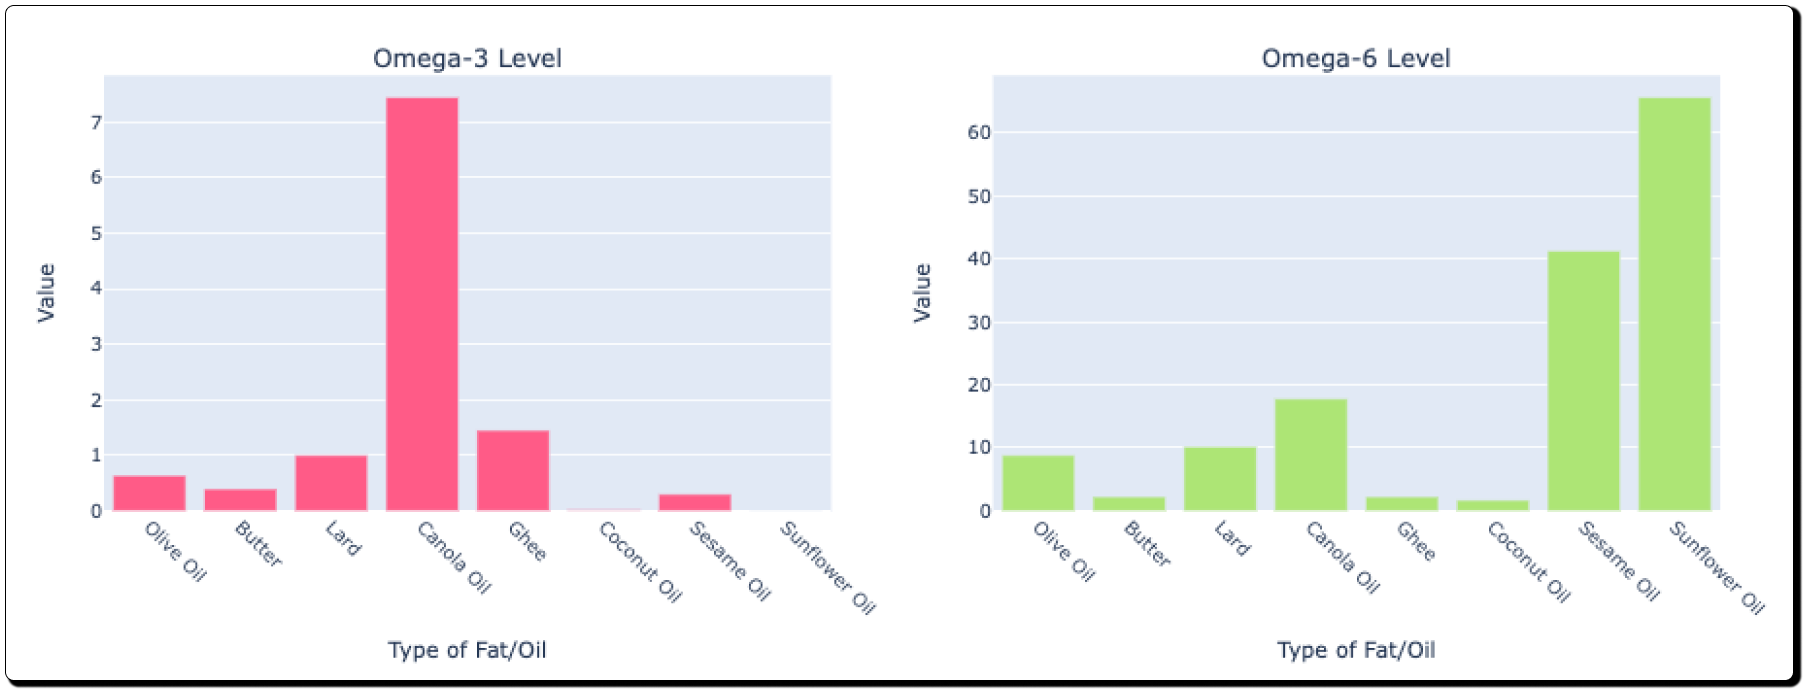
While these are decent, to get an understanding of the ratio, you would need to glimpse back and forth, or make a new bar graph with the specific ratios. Both of these are technically fine.
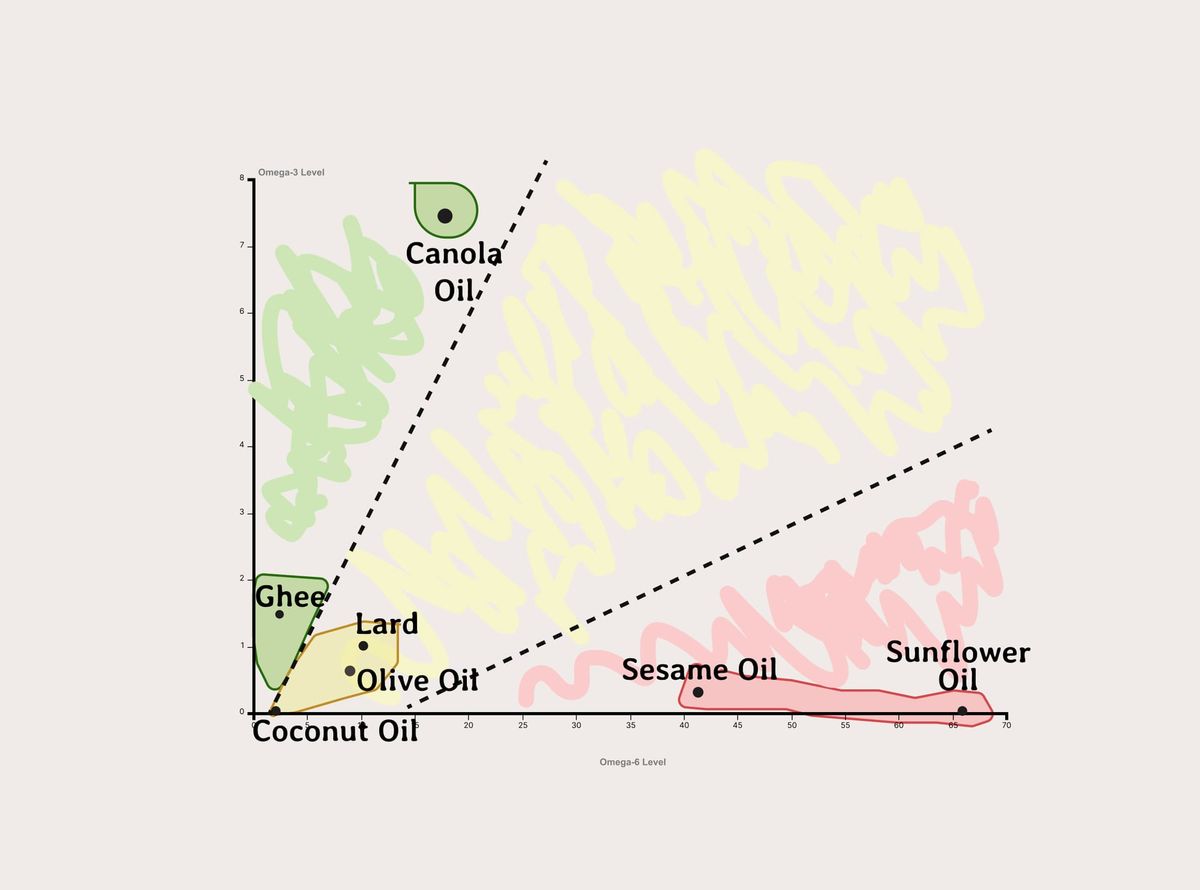
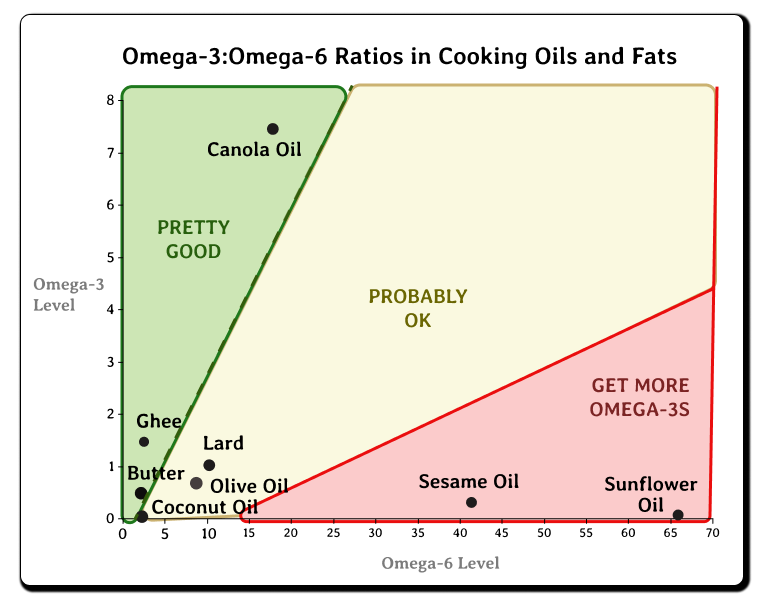
But I also fancy myself an artist, so I wanted to experiment with the graph format. Anytime there is an opportunity to plot two metrics on a scatter plot, I'm there, for the readability and the vibes.
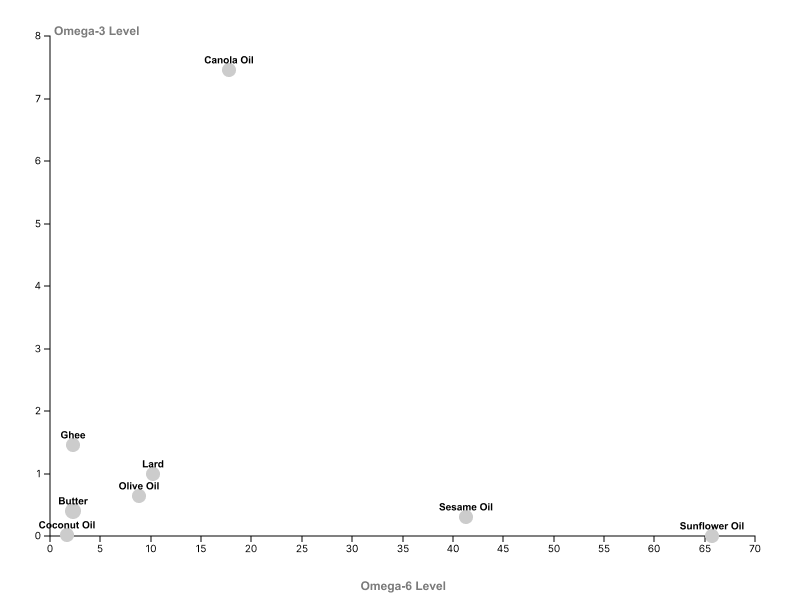
There has been a historical emphasis on reducing saturated fats, leading to increased use of vegetable oils high in Omega-6, so color me surprised that many cooking oils and fats don't actually reach this level; only butter.
Now, with these numbers, it's easy for us to make our own groups. Technically, we could use machine learning, but its easy enough for us to see general patterns with the points, especialy with the knowledge that we want to keep our ranges between 1:1 and 1:4.
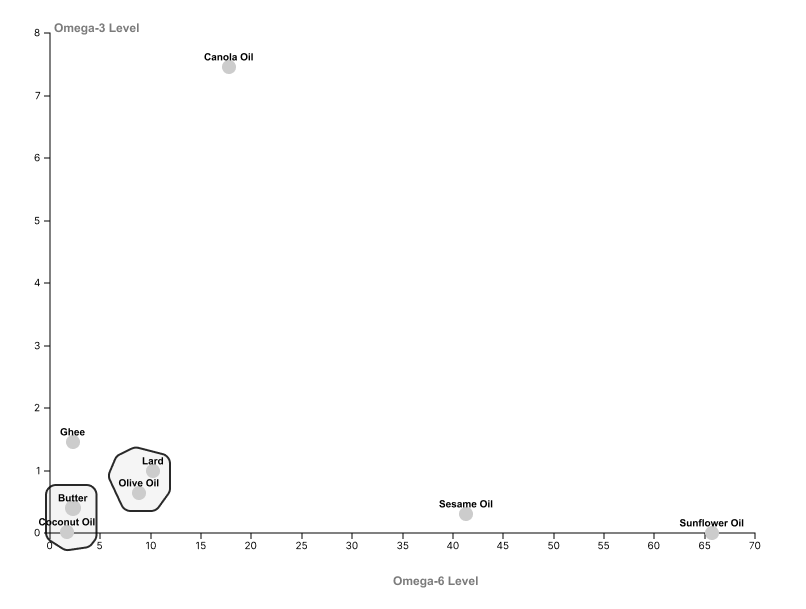
It made sense to draw the slopes of the angles, we can further divide the groups. I also updated the size of the oils with one of my favorite fonts (Averia Libre).
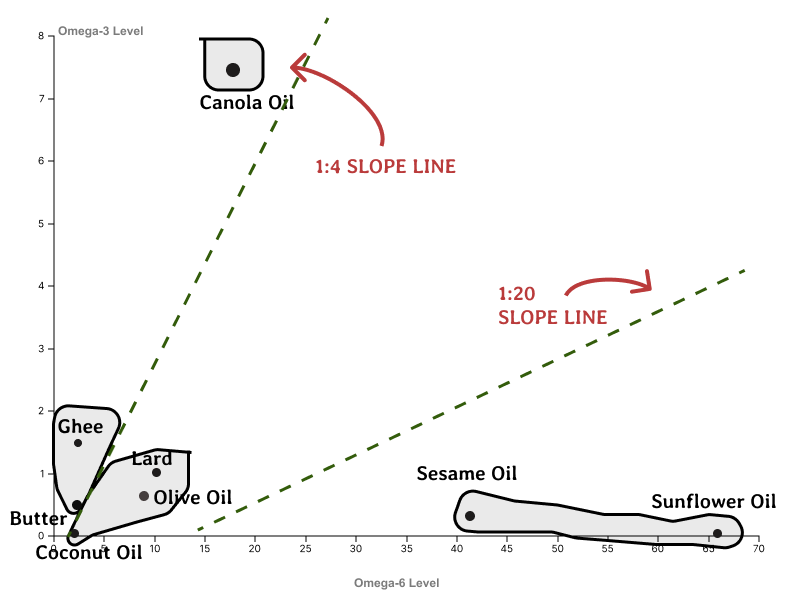
From there, I just used my design sensibilities to make the graph above a little more clear. That included a font change, a new bg color, some grid lines to help trace the dots, and a nice descriptor of what the differences in ratios mean.
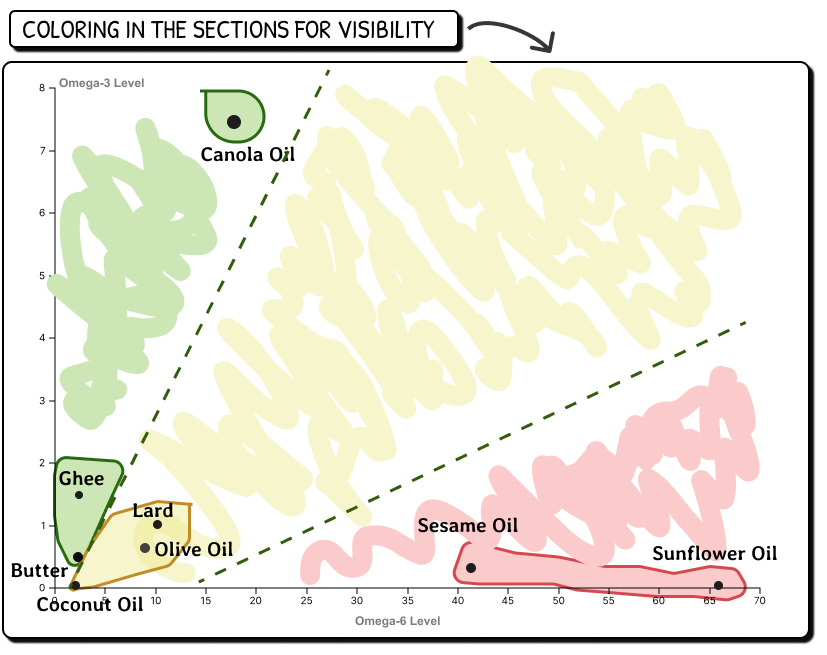
And, ta-da, the final product.
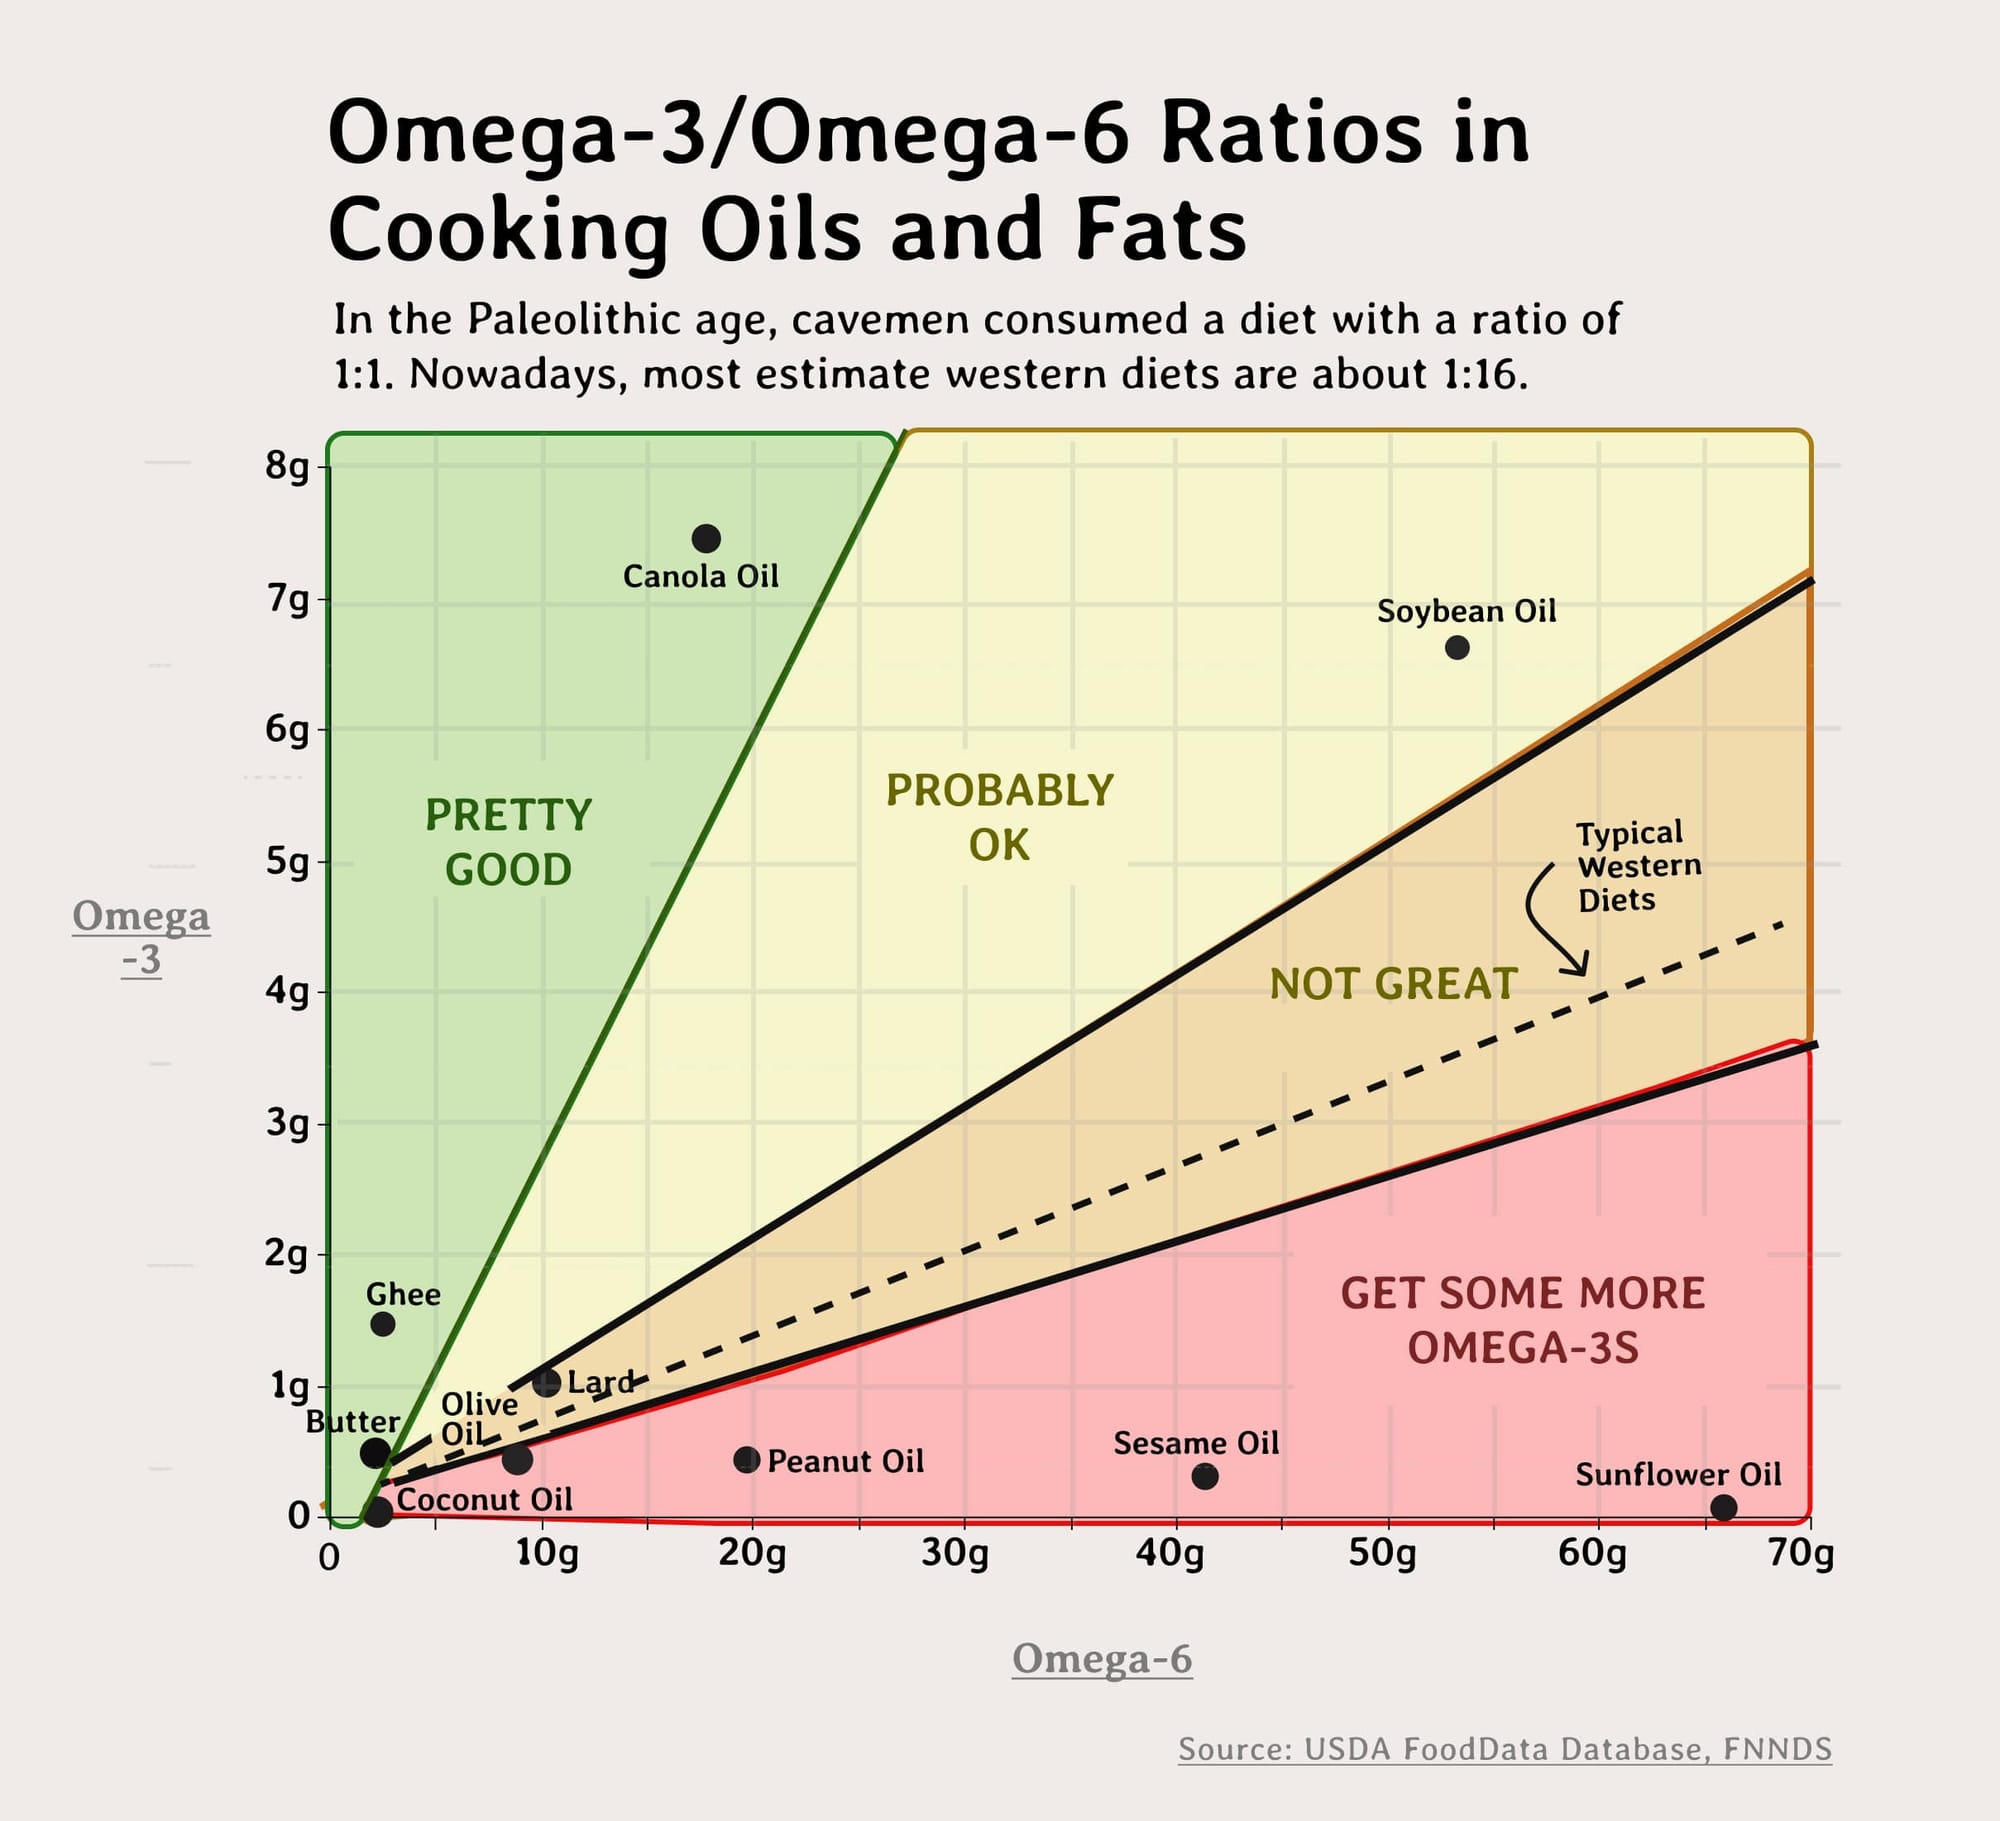
Then, we simply need to add a few necessities for the graphs: a title, a subhead, a source....and voila. Some design tweaks...I also went back and added a few more oils for clarity. Also added a separate line, one that is 1:10, just to better categorize the oils, and also to highlight the goofiness of typical Western diets.