Space Junk, and the Problem of Debris in Space
Gourmet Data is a blog where a data journalist breaks down questions. Subscribe either here on Ghost or on Substack.
I'm obsessed with space, and it's become common knowledge in the past few years that the amount of space exploration humanity has been doing for the past 60 years is not without consequences; namely, space debris.
The debris accumulates on missions, as things in space don't have anywhere to go. In the best of cases, these modules fall back to Earth, gravity being the facilitator. In the worst cases, the things meant to fall back to Earth sometimes fail to re-enter the atmosphere and remain adrift in orbit, contributing to a growing collection of space junk.
As far as I can tell, there are ways to retrieve these space junk objects, as listed here. I like visualizations, so I spent a few hours trying to simulate the space debris in P5.js. The final result seems dire, if not beautiful.
LeoLabs has something a bit more advanced and accurate, if that's your thing. You can say that's the finished version of this project.
Defining the Types of Space Debris
To simulate the code, I had to do some basic research on the scale and amount of space trash currently existing, and streamline that information into something usable for my purposes.
According to international space agencies (ESA, IADC) who record the metric every X amount of years, debris can be classified into three subsections depending on their sizes:
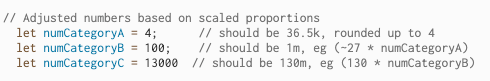
- Small Debris: Over 130 million pieces
- Medium Debris: 1 million pieces
- Large Debris: More than 36,500 pieces
Now, drawing 131m particles on a webpage seems...inefficient. So I scaled down the numbers, but kept the relative ratios so the informative effect could still be achieved. So, instead of 131m, we're gonna settle for something like 13,000.
Defining the Types of Orbits
Space is governed by physics, and orbital mechanics play a crucial role. So, the next task was making sure each type of SpaceObject had a clearly defined orbit.
There are primarily three orbits around Earth:
Low Earth Orbit (LEO): Ranging from about 160 to 1,000 kilometers above Earth's surface, LEO is the most crowded orbit, bustling with satellites, the International Space Station (ISS), and a significant portion of space debris. Objects in LEO are subject to atmospheric drag, which can eventually cause them to deorbit and burn up upon re-entry. Lucky for us, this acts as a natural cleansing effect.
Medium Earth Orbit (MEO): Situated between 2,000 and 35,786 kilometers above Earth, MEO is home to many navigation satellites, and - you guessed it - an array of space debris. The medium-sized debris in MEO is a bit easier to track than small-sized debris, but can pose significant risks to operational satellites due to the relative scarcity of natural de-orbiting mechanisms.
Geostationary Orbit (GEO): Located approximately 35,786 kilometers above the equator, satellites match Earth's rotation in GEO, appearing stationary relative to the ground. The lack of natural de-orbiting forces means debris can stay in GEO for centuries, increasing the risk of collisions (and a collision at this size is mission-critical). As a result, active removal is focused on this category to prevent the Kessler syndrome – a cascade of collisions generating more debris and making certain orbits unusable.
Small debris particles are spread out across all three orbits, and technically, the size of the space debris should determine which orbital range it resides in. This is where I encountered a limitation, and had to come up with a simplified solution (read cop-out) where I created simplified ranges for LEO, MEO, and GEO.
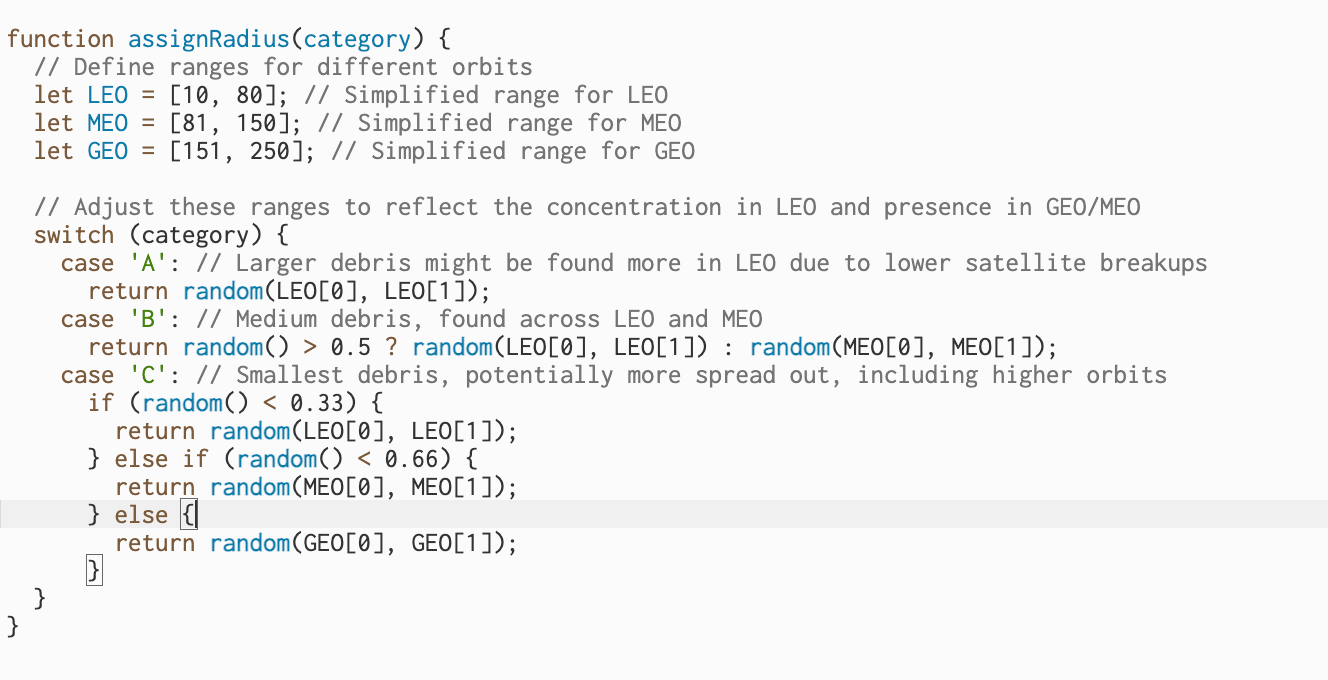
In reality, there would be a lot more physics that influence the process, but ain't nobody got time for that.
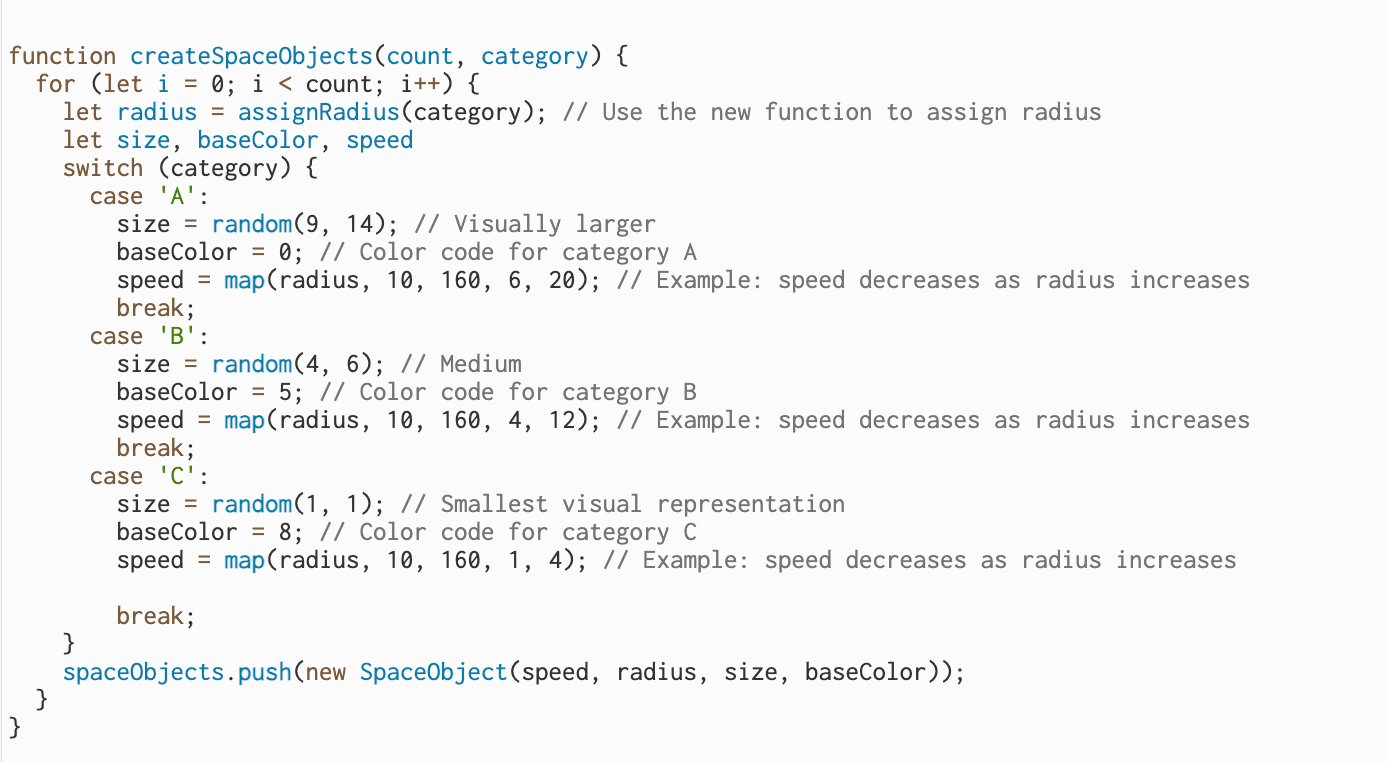
The SpaceObject class now has all the variables necessary to make it work; a size, a color, a radius from Earth (aka its orbit), and a speed (determined by the orbit/radius). This info is limited, but it's enough for a simulation. Here is the code.
2D vs 3D
Now, I created two versions of this graph.
The 2D graph is a bit clearer, in my opinion, but the 3D one technically would be more accurate. This is because there are orbits occur in three dimensions in space, however, most code examples are 2D in the plane of the elliptic out of necessity.
I got to the following point in 3D, and decided the following result was enough for a half-experiment.
What I Missed
This P5.js simulation is simply a simulation, so it's missing a lot of physics. The fact that we had to decrease the amount of debris objects from 130m+ to just a few thousand is one major change that should impact how people interpret this graph.
Collisions are a big part of this equation. Every object within a certain orbit has the ability to influence/interact with other, but there is no accounting for this in the code, eg the space objects have no function to account for collisions, near misses, and orbital changes.
That being said, a simulation is a simulation. It was fun.